

Question: I need help 1.We analyzed the relationship between IMDb ratings and Rotten Tomato ratings for 75 popular movies. The scatterplot showed a fairly strong, positive
I need help
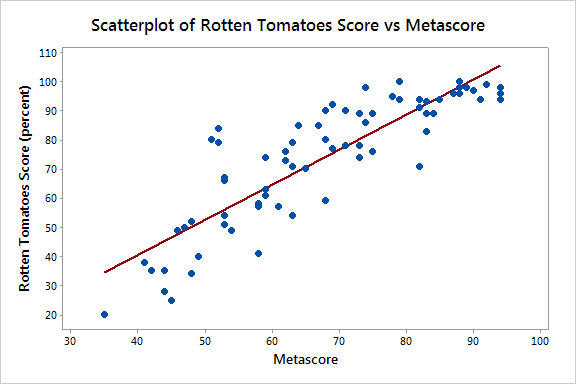
1.We analyzed the relationship between IMDb ratings and Rotten Tomato ratings for 75 popular movies. The scatterplot showed a fairly strong, positive linear association. StatCrunch linear regression results are shown below.
Simple linear regression results:
Dependent Variable: Rotten_Tomatoes
Independent Variable: IMDb_Rating
Rotten_Tomatoes = -57.599288 + 17.919209 IMDb_Rating
Sample size: 75
R (correlation coefficient) = 0.79786226
R-sq = 0.63658418
Estimate of error standard deviation: 12.916488
Which number describes the average amount of error in the regression line's predicted Rotten Tomato ratings?
a.17.9
b.0.80
c.0.64
d.12.92
2.A regression line is the line that best fits the data, but this does not mean that the fit is good. In other words, there can still be a lot of variability about the regression line.
Which combination describes a regression line that is a good fit for the data?
a.Large r-sq and small Se
b.Large r-sq and large Se
c.Small r-sq and small Se
d.Small r-sq and large Se
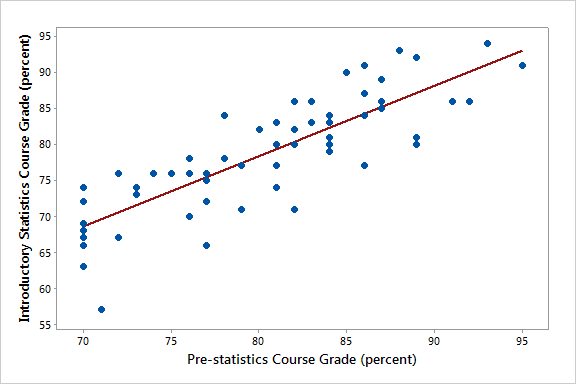
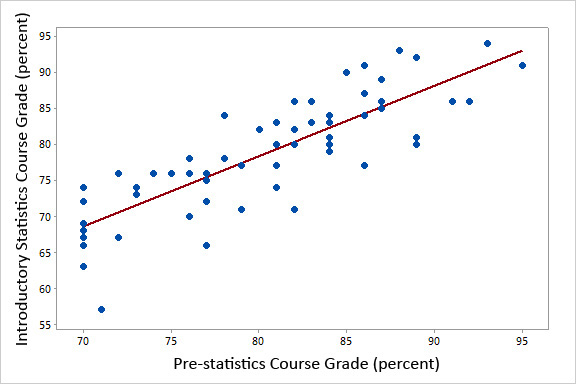
3.Pre-Statistics and Statistics Course Grades:We recorded the pre-statistics course grade (in percent) and introductory statistics course grade (in percent) for 60 community college students. Then we generated the following scatterplot of the data.
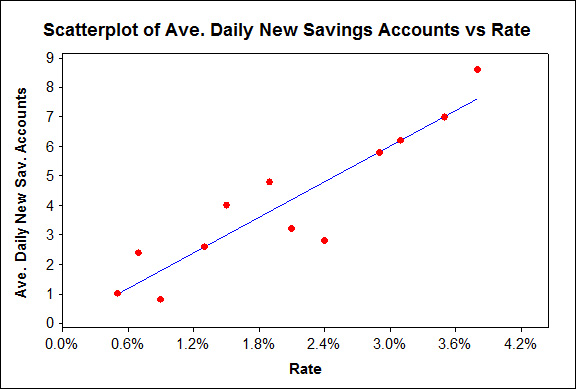
\f\f\f\f\fScatterplot of Ave. Daily New Savings Accounts vs Rate Ave. Daily New Sav. Accounts 8 6 5 4 0 0.0% 0.6% 1.2% 1.8% 2.4% 3.0% 3.6% 4.2% Rate\f\f\f
Step by Step Solution
There are 3 Steps involved in it

Get step-by-step solutions from verified subject matter experts