

Question: i need help and explanation in number 2 Using the samples of incomes for two neighborhoods, INCOME.xIsx, calculate each set's mean, sample standard deviation, minimum
i need help and explanation in number 2 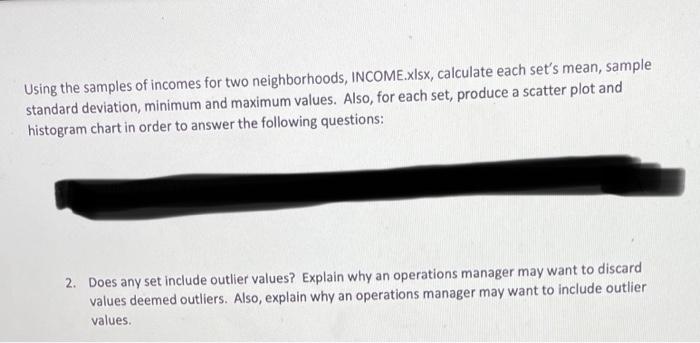
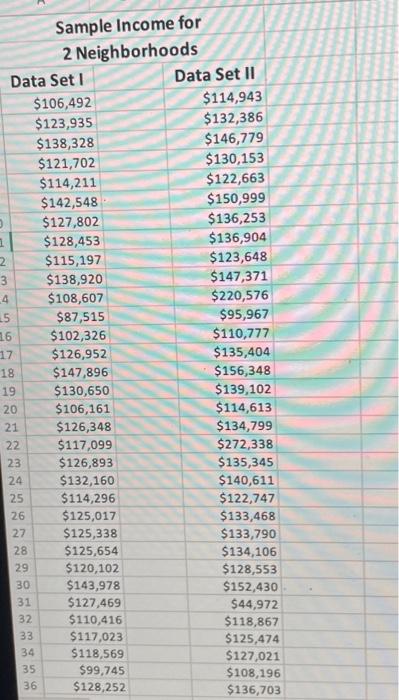
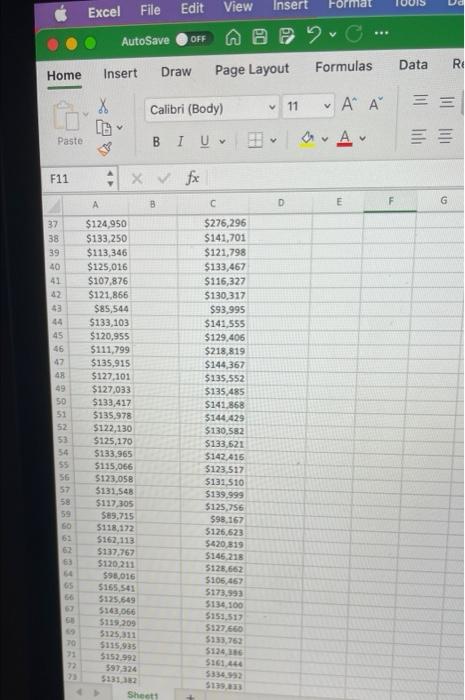
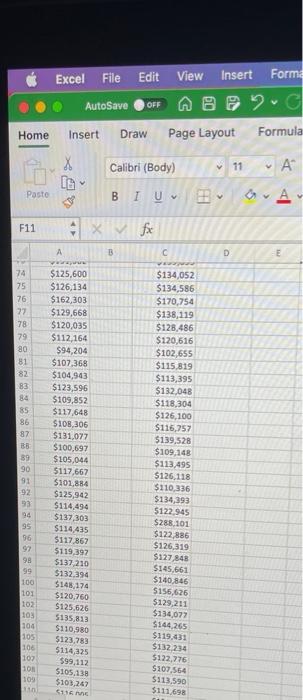
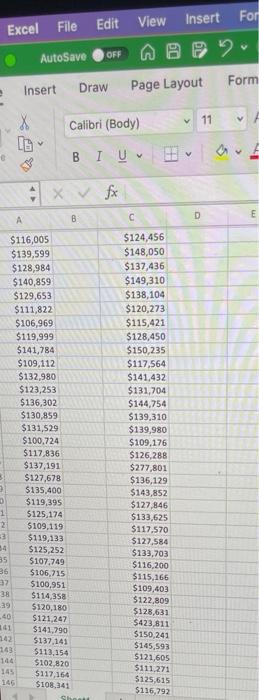
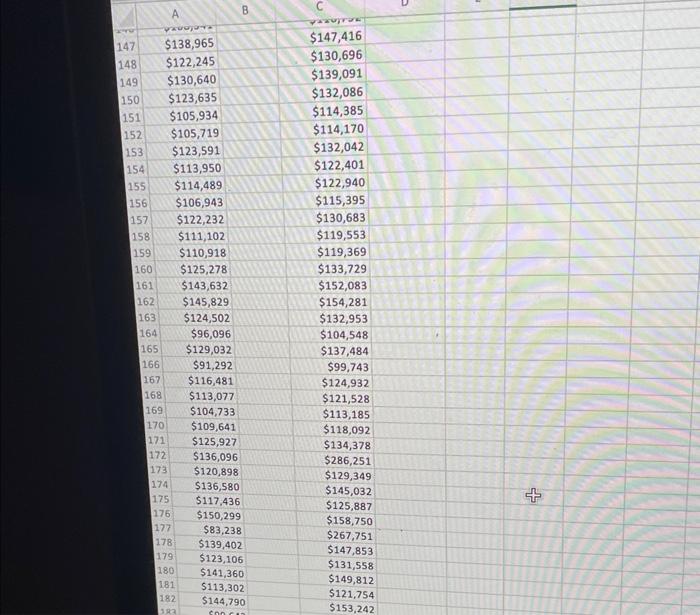
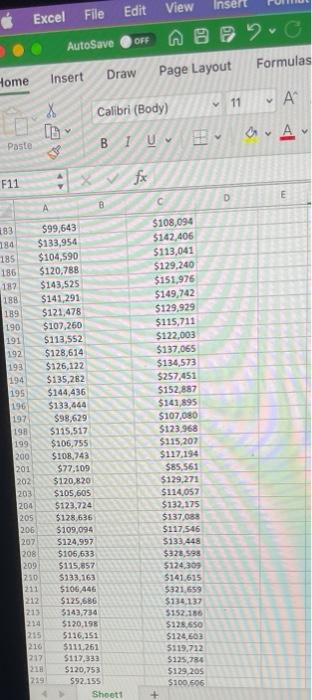
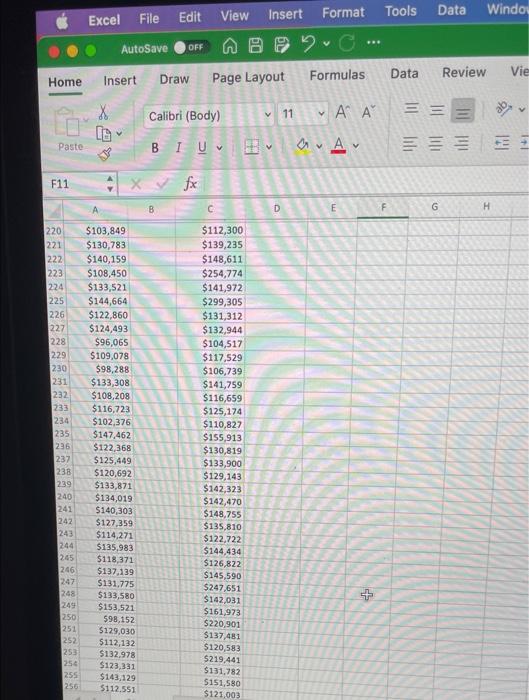
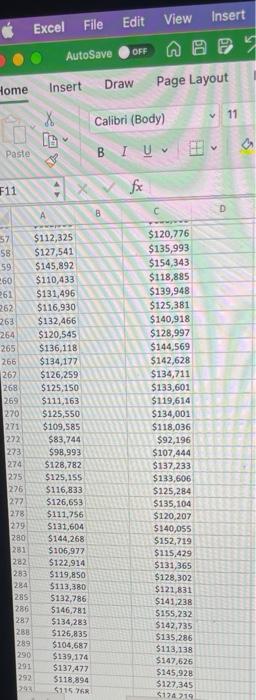
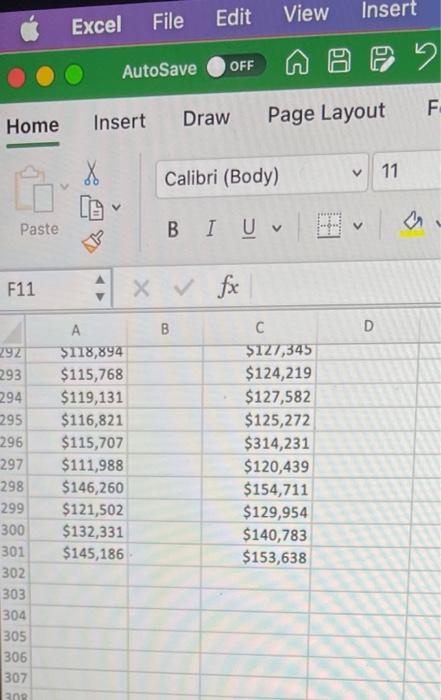
Using the samples of incomes for two neighborhoods, INCOME.xIsx, calculate each set's mean, sample standard deviation, minimum and maximum values. Also, for each set, produce a scatter plot and histogram chart in order to answer the following questions: 2. Does any set include outlier values? Explain why an operations manager may want to discard values deemed outliers. Also, explain why an operations manager may want to include outlier values. Sample Income for 2 Neighborhoods Homed File Edit View Insert Form Home Insert Draw Page Layout Formula Excel Flle Edit View Insert For Autosave O off 95% Insert Draw Page Layout Form \begin{tabular}{|c|c|c|c|} \hline & & A & B \\ \hline 147 & $138,965 & C \\ \hline 148 & $122,245 & $147,416 \\ \hline 149 & $130,640 & $130,696 \\ \hline 150 & $123,635 & $139,091 \\ \hline 151 & $105,934 & $132,086 \\ \hline 152 & $105,719 & $114,385 \\ \hline 153 & $123,591 & $114,170 \\ \hline 154 & $113,950 & $132,042 \\ \hline 155 & $114,489 & $122,401 \\ \hline 156 & $106,943 & $122,940 \\ \hline 157 & $122,232 & $115,395 \\ \hline 158 & $111,102 & $130,683 \\ \hline 159 & $110,918 & $119,553 \\ \hline 160 & $125,278 & $119,369 \\ \hline 161 & $143,632 & $133,729 \\ \hline 162 & $145,829 & $152,083 \\ \hline 163 & $124,502 & $154,281 \\ \hline 164 & $96,096 & $132,953 \\ \hline 165 & $129,032 & $104,548 \\ \hline 166 & $91,292 & $137,484 \\ \hline 167 & $116,481 & $99,743 \\ \hline 168 & $113,077 & $124,932 \\ \hline 169 & $104,733 & $121,528 \\ \hline 170 & $109,641 & $113,185 \\ \hline 171 & $125,927 & $118,092 \\ \hline 172 & $136,096 & $134,378 \\ \hline 173 & $120,898 & $286,251 \\ \hline 174 & $136,580 & $129,349 \\ \hline 175 & $117,436 & $145,032 \\ \hline & 176 & $150,299 & $125,887 \\ \hline & 177 & $83,238 & $158,750 \\ \hline 178 & $139,402 & $267,751 \\ \hline 179 & $123,106 & $147,853 \\ \hline & 180 & $141,360 & $131,502 \\ \hline & $182 & $90 & $149,812 \\ \hline \end{tabular} Excel File Edit View Insert Format Tools Data Windo Home Insert Draw Pagelayout Formulas Data Review Vie AutoSave O off File Edit View Insert lome Insert Draw Page Layout Home Insert Draw Page Layout FF Using the samples of incomes for two neighborhoods, INCOME.xIsx, calculate each set's mean, sample standard deviation, minimum and maximum values. Also, for each set, produce a scatter plot and histogram chart in order to answer the following questions: 2. Does any set include outlier values? Explain why an operations manager may want to discard values deemed outliers. Also, explain why an operations manager may want to include outlier values. Sample Income for 2 Neighborhoods Homed File Edit View Insert Form Home Insert Draw Page Layout Formula Excel Flle Edit View Insert For Autosave O off 95% Insert Draw Page Layout Form \begin{tabular}{|c|c|c|c|} \hline & & A & B \\ \hline 147 & $138,965 & C \\ \hline 148 & $122,245 & $147,416 \\ \hline 149 & $130,640 & $130,696 \\ \hline 150 & $123,635 & $139,091 \\ \hline 151 & $105,934 & $132,086 \\ \hline 152 & $105,719 & $114,385 \\ \hline 153 & $123,591 & $114,170 \\ \hline 154 & $113,950 & $132,042 \\ \hline 155 & $114,489 & $122,401 \\ \hline 156 & $106,943 & $122,940 \\ \hline 157 & $122,232 & $115,395 \\ \hline 158 & $111,102 & $130,683 \\ \hline 159 & $110,918 & $119,553 \\ \hline 160 & $125,278 & $119,369 \\ \hline 161 & $143,632 & $133,729 \\ \hline 162 & $145,829 & $152,083 \\ \hline 163 & $124,502 & $154,281 \\ \hline 164 & $96,096 & $132,953 \\ \hline 165 & $129,032 & $104,548 \\ \hline 166 & $91,292 & $137,484 \\ \hline 167 & $116,481 & $99,743 \\ \hline 168 & $113,077 & $124,932 \\ \hline 169 & $104,733 & $121,528 \\ \hline 170 & $109,641 & $113,185 \\ \hline 171 & $125,927 & $118,092 \\ \hline 172 & $136,096 & $134,378 \\ \hline 173 & $120,898 & $286,251 \\ \hline 174 & $136,580 & $129,349 \\ \hline 175 & $117,436 & $145,032 \\ \hline & 176 & $150,299 & $125,887 \\ \hline & 177 & $83,238 & $158,750 \\ \hline 178 & $139,402 & $267,751 \\ \hline 179 & $123,106 & $147,853 \\ \hline & 180 & $141,360 & $131,502 \\ \hline & $182 & $90 & $149,812 \\ \hline \end{tabular} Excel File Edit View Insert Format Tools Data Windo Home Insert Draw Pagelayout Formulas Data Review Vie AutoSave O off File Edit View Insert lome Insert Draw Page Layout Home Insert Draw Page Layout FF
Step by Step Solution
There are 3 Steps involved in it
1 Expert Approved Answer
Step: 1 Unlock

Question Has Been Solved by an Expert!
Get step-by-step solutions from verified subject matter experts
Step: 2 Unlock
Step: 3 Unlock