

Question: i need help Annual and Average Returns for Stocks, Bonds, and T-Bills, 1950 to 2015 Long-Tere Treasury Bonds T-bills 2015 Average 6.6% 4.40% 1959 Average
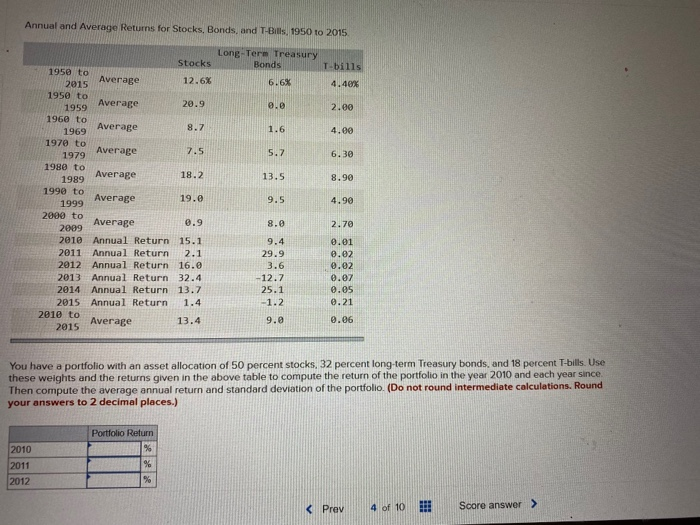
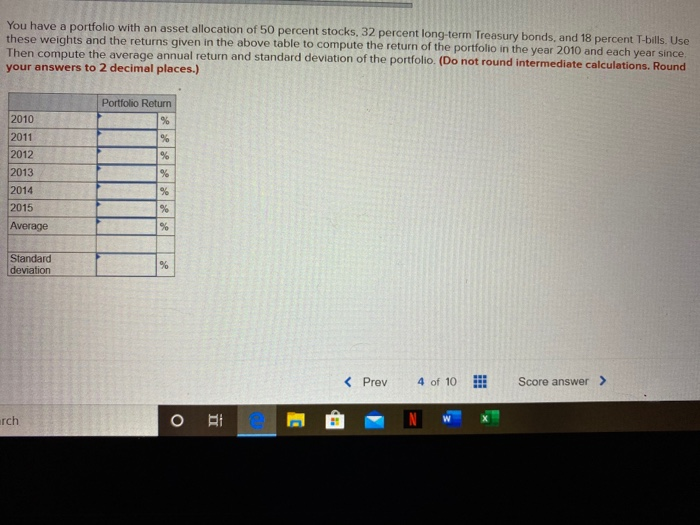
Annual and Average Returns for Stocks, Bonds, and T-Bills, 1950 to 2015 Long-Tere Treasury Bonds T-bills 2015 Average 6.6% 4.40% 1959 Average 0.0 2.00 4.00 5.7 6.30 8.90 Stocks 1950 to 12.6% 1950 to 20.9 1960 to 1969 Average 8.7 1970 to 1979 Average 7.5 1980 to 1989 Average 18.2 1990 to 1999 Average 19.0 2000 to 2009 Average 0.9 2018 Annual Return 15.1 2011 Annual Return 2.1 2012 Annual Return 16.0 2013 Annual Return 32.4 2014 Annual Return 13.7 2015 Annual Return 1.4 2010 to Average 13.4 2015 4.90 8.0 9.4 29.9 3.6 -12.7 25.1 1.2 2.70 0.01 0.02 0.02 0.07 0.05 0.21 0.06 9.0 You have a portfolio with an asset allocation of 50 percent stocks, 32 percent long-term Treasury bonds, and 18 percent T-bills Use these weights and the returns given in the above table to compute the return of the portfolio in the year 2010 and each year since. Then compute the average annual return and standard deviation of the portfolio. (Do not round intermediate calculations. Round your answers to 2 decimal places.) Portfolio Return 2010 2011 2012 Prev 4 of 10 !!! Score answer > You have a portfolio with an asset allocation of 50 percent stocks, 32 percent long-term Treasury bonds, and 18 percent T-bills. Use these weights and the returns given in the above table to compute the return of the portfolio in the year 2010 and each year since. Then compute the average annual return and standard deviation of the portfolio. (Do not round intermediate calculations. Round your answers to 2 decimal places.) Portfolio Return 2010 2012 2013 2014 2015 Average Standard deviation rch
Step by Step Solution
There are 3 Steps involved in it

Get step-by-step solutions from verified subject matter experts