

Question: I need help answering all these questions!!!! Please!!! For b) graph the total fixed cost For c) graph the marginal cost and the average total
I need help answering all these questions!!!! Please!!!
For b) graph the total fixed cost
For c) graph the marginal cost and the average total cost
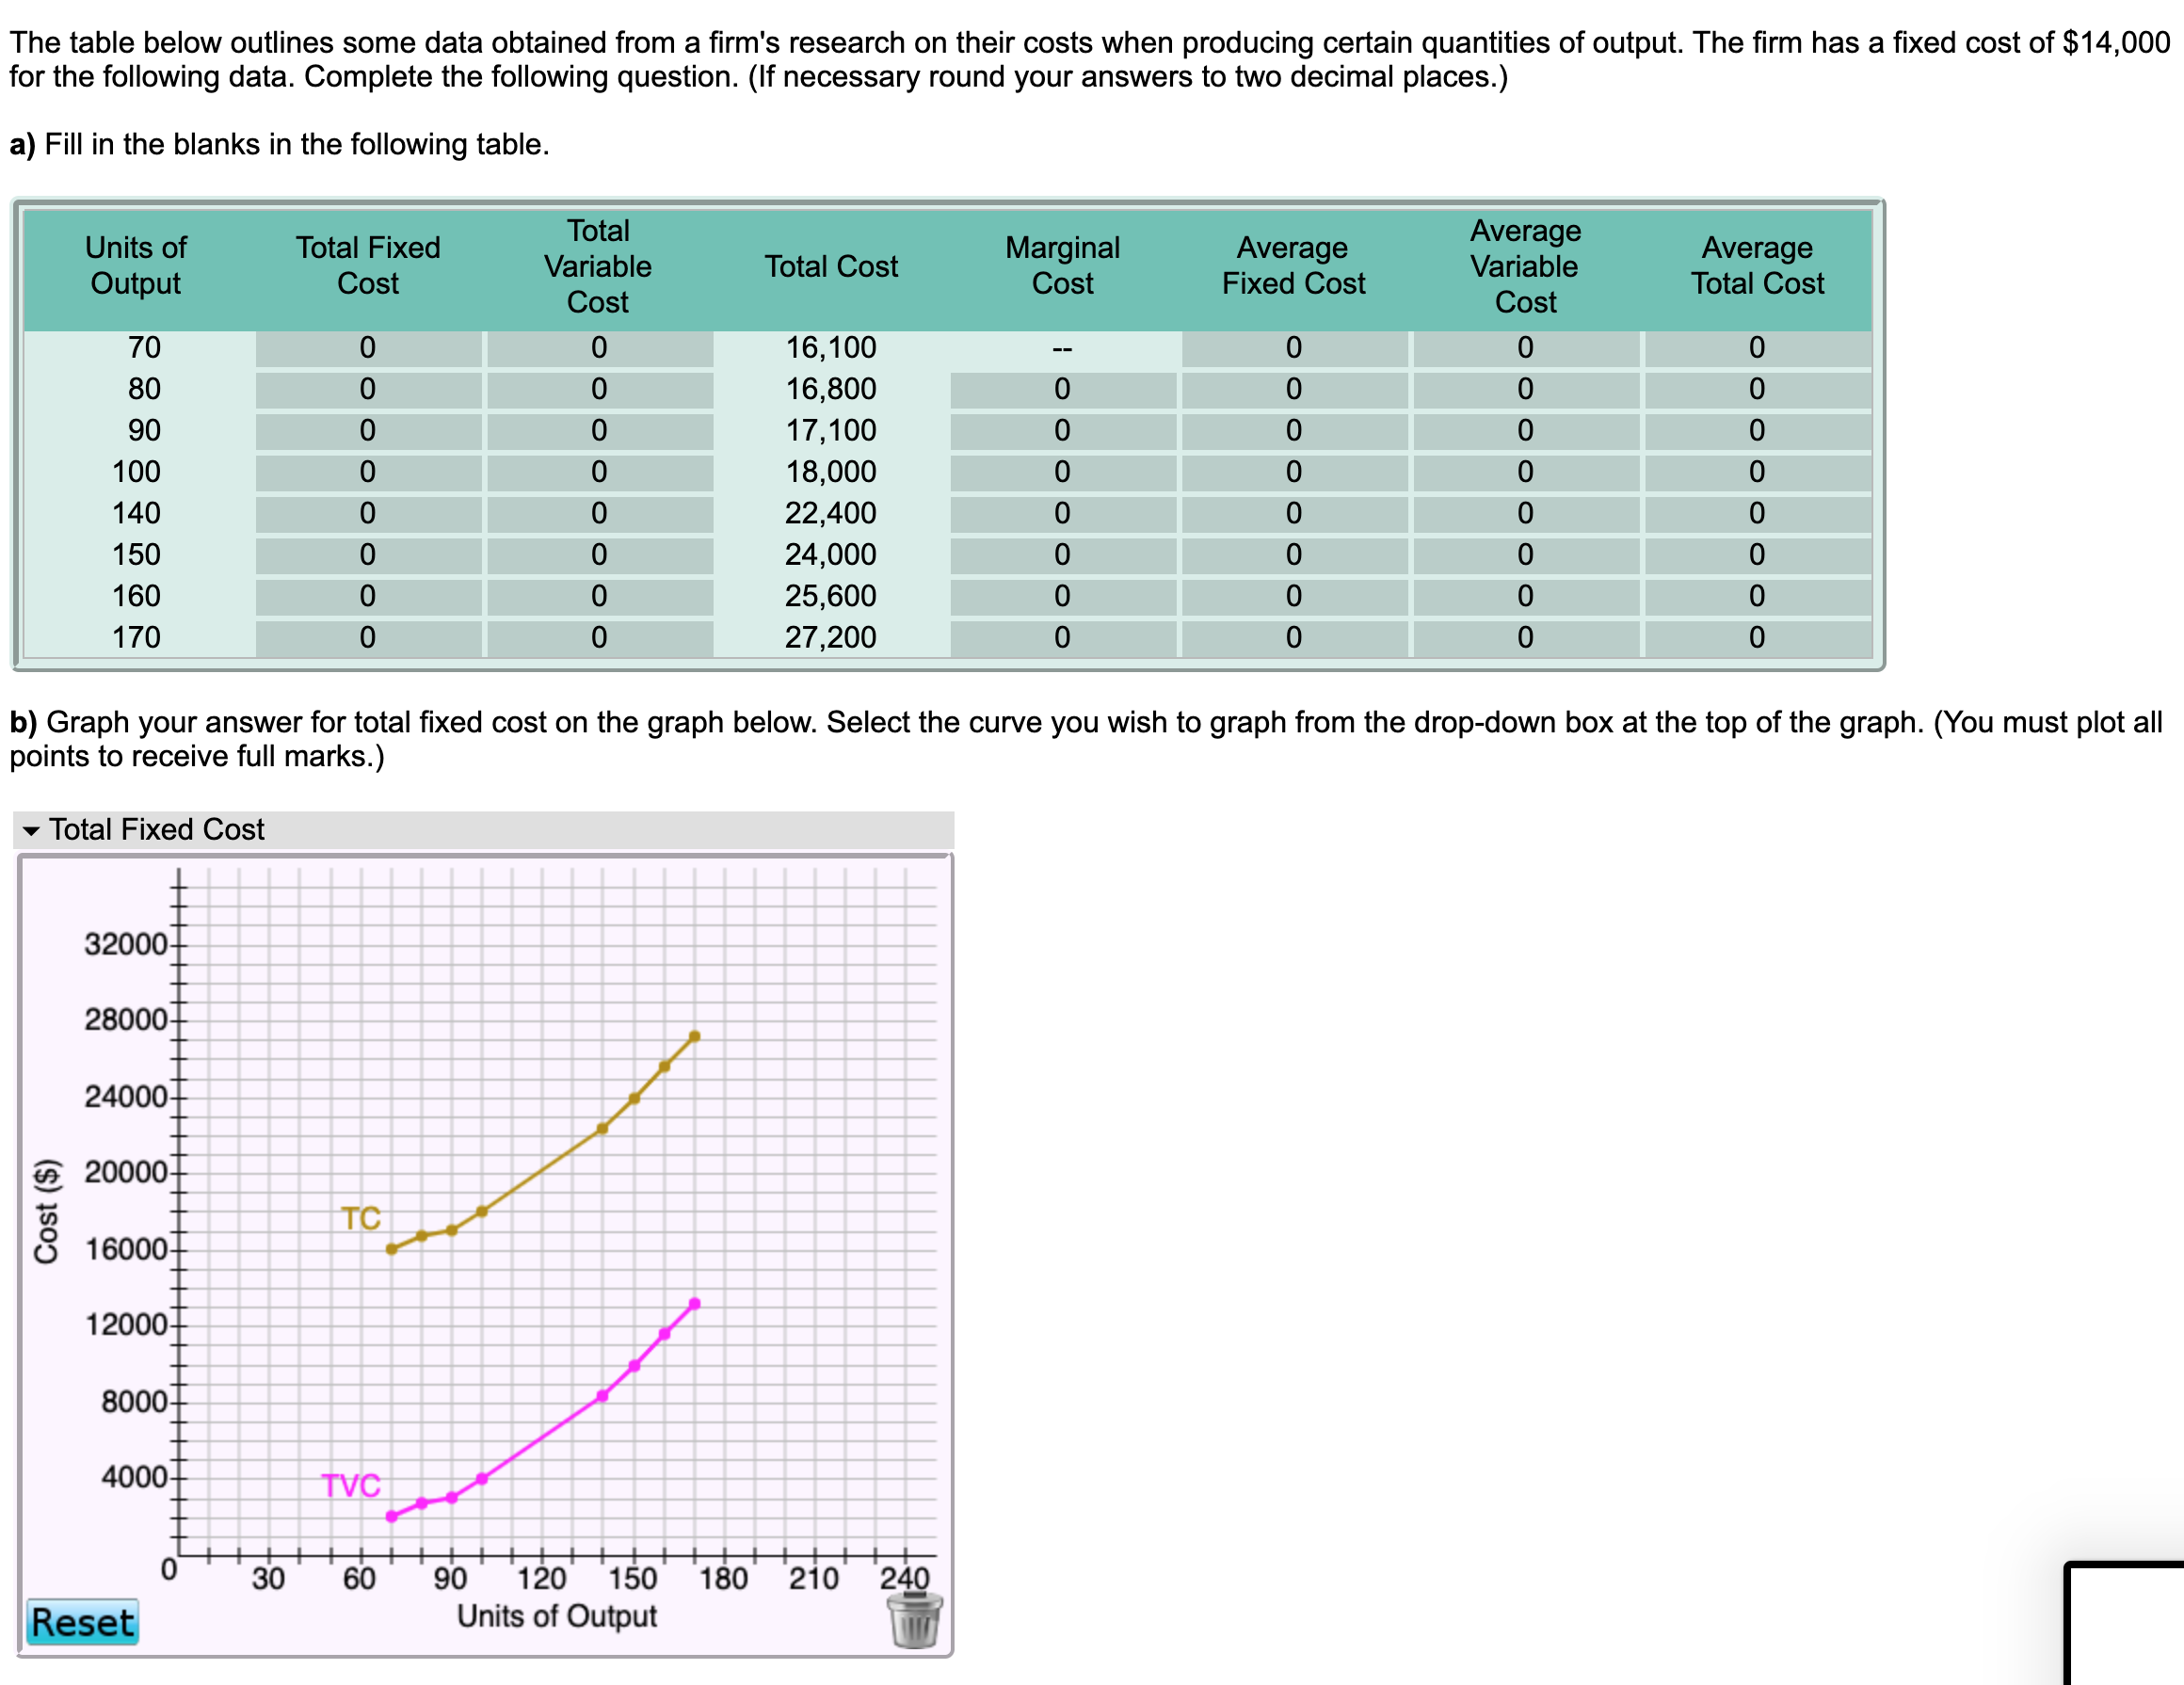
The table below outlines some data obtained from a firm's research on their costs when producing certain quantities of output. The firm has a fixed cost of $14,000 for the following data. Complete the following question. (If necessary round your answers to two decimal places.) a) Fill in the blanks in the following table. Total Fixed Total Marginal Average Units of Average Total Cost Variable Average Output Cost Variable Cost Fixed Cost Cost Total Cost Cost 70 0 0 16, 100 0 80 16,800 O O O OO OO 90 17, 100 0 100 0 0 18,000 0 0 ooo ooo O O 140 22,400 0 o O OO o O O O 150 24,000 160 25,600 o o O O 170 27,200 O b) Graph your answer for total fixed cost on the graph below. Select the curve you wish to graph from the drop-down box at the top of the graph. (You must plot all points to receive full marks.) Total Fixed Cost 32000- 28000 Cost ($) TC 8000 4000 TVC 30 60 90 120 150 180 210 240 Reset Units of Output
Step by Step Solution
There are 3 Steps involved in it

Get step-by-step solutions from verified subject matter experts