

Question: i need help answering question based on information. this is the data and im needing to answer the question AGE GENDER (1=male, 2 female INCOME

 the question
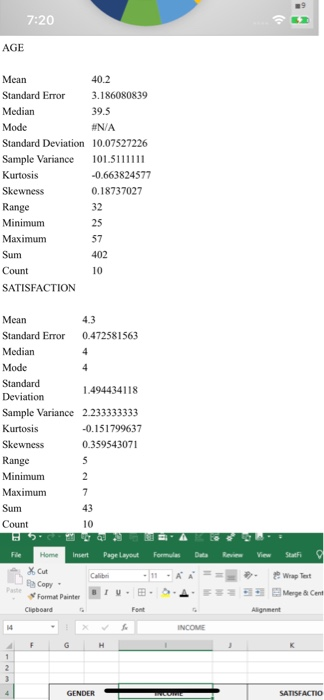


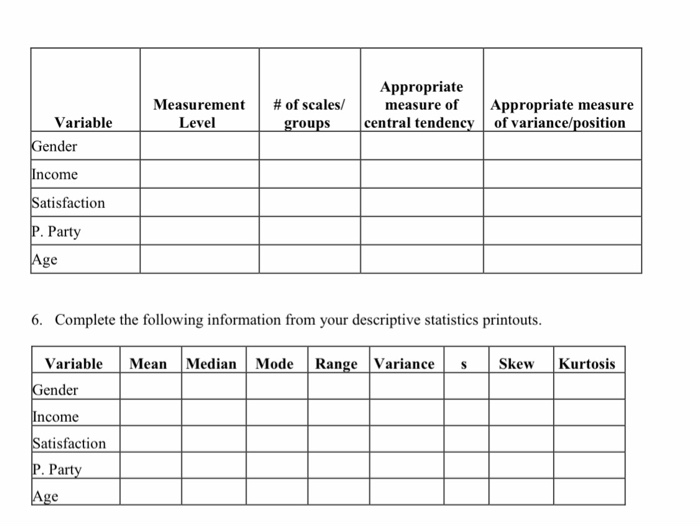
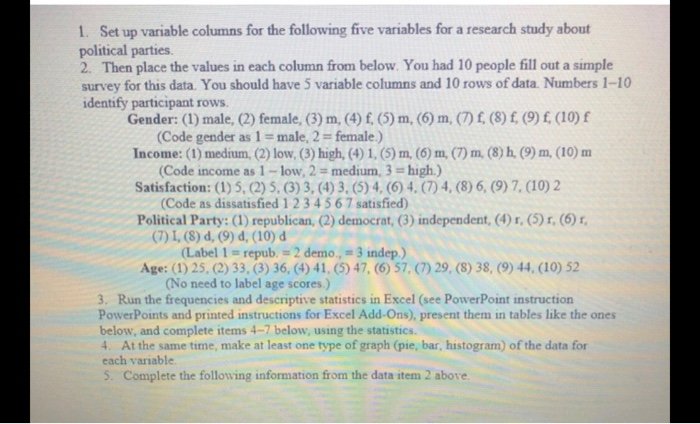
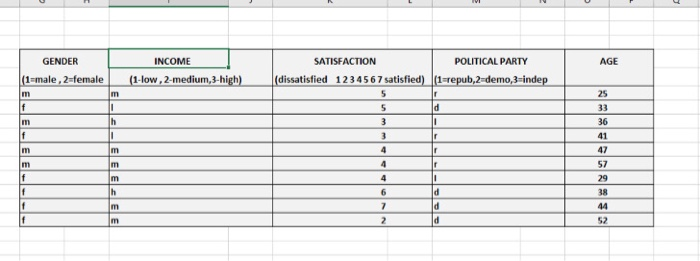
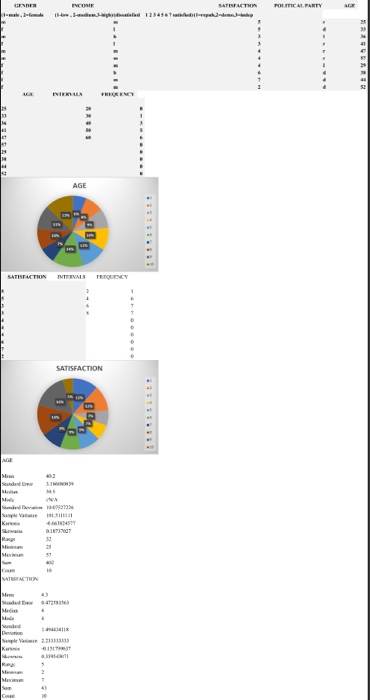
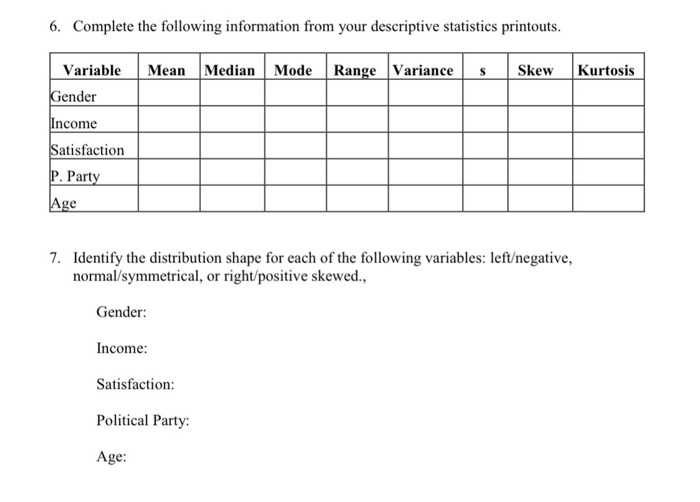
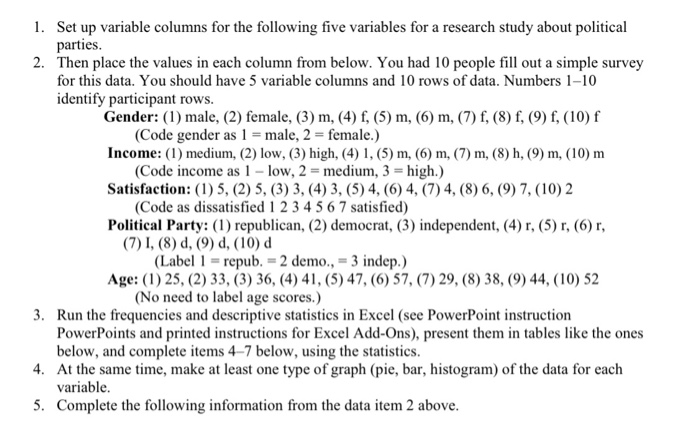
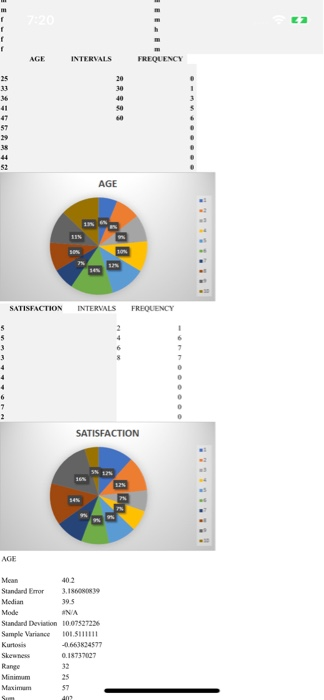
AGE GENDER (1=male, 2 female INCOME (1-low, 2-medium 3-high) SATISFACTION POLITICAL PARTY (dissatisfied 1234567 satisfied) (1=repub,2-demo, 3-indep m m un r If 5 3 m h 1 f - 3 ir m m r 25 33 36 41 47 57 29 38 44 52 m m f m 4 4 4 6 7 2 1 h Im d d d If m CE INNI SATISFACTION POLITICAL PARTY ar INIKKENS FREE AGE SATISFACTH INTERVALS TROUENCY SATISFACTION MS NA Saldi Sample kw 102 . SATTACH 472 9 Measurement Level # of scales/ groups Appropriate measure of Appropriate measure central tendency of variance/position Variable Gender Income Satisfaction P. Party Age 6. Complete the following information from your descriptive statistics printouts. Mean Median Mode Range Variance S Skew Kurtosis Variable Gender Income Satisfaction P. Party Age 6. Complete the following information from your descriptive statistics printouts. Mean Median Mode Range Variance s Skew Kurtosis Variable Gender Income Satisfaction P. Party Age 7. Identify the distribution shape for each of the following variables: leftegative, normal/symmetrical, or right/positive skewed., Gender: Income: Satisfaction: Political Party: Age: 1. Set up variable columns for the following five variables for a research study about political parties. 2. Then place the values in each column from below. You had 10 people fill out a simple survey for this data. You should have 5 variable columns and 10 rows of data. Numbers 1-10 identify participant rows. Gender: (1) male, (2) female, (3) m, (4) f, (5) m, (6) m, (7) f, (8) f, (9) f, (10) f (Code gender as 1 = male, 2 = female.) Income: (1) medium, (2) low, (3) high, (4) 1, (5) m, (6) m, (7) m, (8) h, (9) m, (10) m (Code income as 1 - low, 2 = medium, 3 = high.) Satisfaction: (1) 5, (2) 5, (3) 3, (4) 3, (5) 4, (6) 4, (7) 4, (8) 6, (9) 7, (10) 2 (Code as dissatisfied 1 2 3 4 5 6 7 satisfied) Political Party: (1) republican, (2) democrat, (3) independent, (4) r, (5) r, (6)r, (7) I, (8) d, (9) d (10) (Label 1 = repub. = 2 demo., = 3 indep.) Age: (1) 25, (2) 33, (3) 36, (4) 41, (5) 47, (6) 57, (7) 29, (8) 38, (9) 44, (10) 52 (No need to label age scores.) 3. Run the frequencies and descriptive statistics in Excel (see PowerPoint instruction PowerPoints and printed instructions for Excel Add-Ons), present them in tables like the ones below, and complete items 4-7 below, using the statistics. 4. At the same time, make at least one type of graph (pie, bar, histogram) of the data for each variable. 5. Complete the following information from the data item 2 above. m 2 AGE INTERVALS FREQUENCY 25 20 41 47 57 38 44 AGE SATISFACTION INTERVALS FREQUENCY 6 2 SATISFACTION Page AGE Mean 402 Standard Error 3.186089 Median 395 Mode #N/A Standard Deviation 1007527226 Sample Variance 101.511111 Kurios -0.663624577 Skewness 0.1873707 Range Minimum Maximum $7 Sum 402 7:20 >> AGE Mean 40.2 Standard Error 3.186080839 Median 39.5 Mode #N/A Standard Deviation 10.07527226 Sample Variance 101.5111111 Kurtosis -0.663824577 Skewness 0.18737027 Range 32 Minimum 25 Maximum 57 Sum 402 Count 10 SATISFACTION Mean 4.3 Standard Error 0.472581563 Median Mode 4 Standard 1.494434118 Deviation Sample Variance 2.233333333 Kurtosis -0.151799637 Skewness 0.359543071 Range 5 Minimum 2 Maximum 7 Sum 43 Count 10 File Formulas Data Revies View Home Insert Page Layout X Cut Calibri Copy Format Painter I Clipboard Font Paste Wrap Test Merge & Cent Alignment 14 INCOME G 1 2 3 4 GENDER SATISFACTIO AGE GENDER (1=male, 2 female INCOME (1-low, 2-medium 3-high) SATISFACTION POLITICAL PARTY (dissatisfied 1234567 satisfied) (1=repub,2-demo, 3-indep m m un r If 5 3 m h 1 f - 3 ir m m r 25 33 36 41 47 57 29 38 44 52 m m f m 4 4 4 6 7 2 1 h Im d d d If m 1. Set up variable columns for the following five variables for a research study about political parties. 2. Then place the values in each column from below. You had 10 people fill out a simple survey for this data. You should have 5 variable columns and 10 rows of data. Numbers 1-10 identify participant rows. Gender: (1) male, (2) female, (3) m, (4) f, (5) m, (6) m, (7) f, (8) f, (9) f, (10) f (Code gender as 1 = male, 2 = female.) Income: (1) medium, (2) low, (3) high, (4) 1, (5) m, (6) m, (7) m, (8) h, (9) m, (10) m (Code income as 1 - low, 2 = medium, 3 = high.) Satisfaction: (1) 5, (2) 5, (3) 3, (4) 3, (5) 4, (6) 4, (7) 4, (8) 6, (9) 7, (10) 2 (Code as dissatisfied 1 2 3 4 5 6 7 satisfied) Political Party: (1) republican, (2) democrat, (3) independent, (4) r, (5) r, (6)r, (7) I, (8) d, (9) d, (10) d (Label 1 = repub. = 2 demo., = 3 indep.) Age: (1)25, (2) 33, (3) 36, (4) 41, (5) 47, (6) 57, (7) 29, (8) 38, (9) 44, (10) 52 (No need to label age scores.) 3. Run the frequencies and descriptive statistics in Excel (see PowerPoint instruction PowerPoints and printed instructions for Excel Add-Ons), present them in tables like the ones below, and complete items 4-7 below, using the statistics. 4. At the same time, make at least one type of graph (pie, bar, histogram) of the data for each variable. 5. Complete the following information from the data item 2 above. Measurement Level # of scales/ groups Appropriate measure of Appropriate measure central tendency of variance/position Variable Gender Income Satisfaction P. Party Age 6. Complete the following information from your descriptive statistics printouts. Mean Median Mode Range Variance S Skew Kurtosis Variable Gender Income Satisfaction P. Party Age 1. Set up variable columns for the following five variables for a research study about political parties. 2. Then place the values in each column from below. You had 10 people fill out a simple survey for this data. You should have 5 variable columns and 10 rows of data. Numbers 1-10 identify participant rows. Gender: (1) male, (2) female, (3) m, (4) f. (5) m, (6) m, (7) f. (8) f. (9) f. (10) f (Code gender as 1 = male, 2 = female.) Income: (1) medium, (2) low, (3) high, (4) 1, (5) m, (6) m, (7) m. (8) h. (9) m. (10) m (Code income as 1 - low, 2 = medium, 3 = high.) Satisfaction: (1) 5.(2)5, (3) 3. (4) 3. (5) 4. (6) 4 (7) 4. (8) 6. (9) 7. (10) 2 (Code as dissatisfied 1 2 3 4 5 6 7 satisfied) Political Party: (1) republican, (2) democrat, (3) independent, (4) r, (5), (6), (7) I, (8) d, (9) d (10) (Label 1 = repub, = 2 demo., = 3 indep) Age: (1) 25. (2) 33, (3) 36, (4) 41, (5) 47, 6) 57. (7) 29 (8) 38, (9) 44 (10) 52 (No need to label age scores.) 3. Run the frequencies and descriptive statistics in Excel (see PowerPoint instruction Power Points and printed instructions for Excel Add-Ons), present them in tables like the ones below, and complete items 4-7 below, using the statistics. 4. At the same time, make at least one type of graph (pie, bar, histogram) of the data for each variable 5. Complete the following information from the data item 2 above. AGE GENDER (1=male, 2 female INCOME (1-low, 2-medium 3-high) SATISFACTION POLITICAL PARTY (dissatisfied 1234567 satisfied) (1=repub,2-demo, 3-indep m m un r If 5 3 m h 1 f - 3 ir m m r 25 33 36 41 47 57 29 38 44 52 m m f m 4 4 4 6 7 2 1 h Im d d d If m CE INNI SATISFACTION POLITICAL PARTY ar INIKKENS FREE AGE SATISFACTH INTERVALS TROUENCY SATISFACTION MS NA Saldi Sample kw 102 . SATTACH 472 9 Measurement Level # of scales/ groups Appropriate measure of Appropriate measure central tendency of variance/position Variable Gender Income Satisfaction P. Party Age 6. Complete the following information from your descriptive statistics printouts. Mean Median Mode Range Variance S Skew Kurtosis Variable Gender Income Satisfaction P. Party Age 6. Complete the following information from your descriptive statistics printouts. Mean Median Mode Range Variance s Skew Kurtosis Variable Gender Income Satisfaction P. Party Age 7. Identify the distribution shape for each of the following variables: leftegative, normal/symmetrical, or right/positive skewed., Gender: Income: Satisfaction: Political Party: Age: 1. Set up variable columns for the following five variables for a research study about political parties. 2. Then place the values in each column from below. You had 10 people fill out a simple survey for this data. You should have 5 variable columns and 10 rows of data. Numbers 1-10 identify participant rows. Gender: (1) male, (2) female, (3) m, (4) f, (5) m, (6) m, (7) f, (8) f, (9) f, (10) f (Code gender as 1 = male, 2 = female.) Income: (1) medium, (2) low, (3) high, (4) 1, (5) m, (6) m, (7) m, (8) h, (9) m, (10) m (Code income as 1 - low, 2 = medium, 3 = high.) Satisfaction: (1) 5, (2) 5, (3) 3, (4) 3, (5) 4, (6) 4, (7) 4, (8) 6, (9) 7, (10) 2 (Code as dissatisfied 1 2 3 4 5 6 7 satisfied) Political Party: (1) republican, (2) democrat, (3) independent, (4) r, (5) r, (6)r, (7) I, (8) d, (9) d (10) (Label 1 = repub. = 2 demo., = 3 indep.) Age: (1) 25, (2) 33, (3) 36, (4) 41, (5) 47, (6) 57, (7) 29, (8) 38, (9) 44, (10) 52 (No need to label age scores.) 3. Run the frequencies and descriptive statistics in Excel (see PowerPoint instruction PowerPoints and printed instructions for Excel Add-Ons), present them in tables like the ones below, and complete items 4-7 below, using the statistics. 4. At the same time, make at least one type of graph (pie, bar, histogram) of the data for each variable. 5. Complete the following information from the data item 2 above. m 2 AGE INTERVALS FREQUENCY 25 20 41 47 57 38 44 AGE SATISFACTION INTERVALS FREQUENCY 6 2 SATISFACTION Page AGE Mean 402 Standard Error 3.186089 Median 395 Mode #N/A Standard Deviation 1007527226 Sample Variance 101.511111 Kurios -0.663624577 Skewness 0.1873707 Range Minimum Maximum $7 Sum 402 7:20 >> AGE Mean 40.2 Standard Error 3.186080839 Median 39.5 Mode #N/A Standard Deviation 10.07527226 Sample Variance 101.5111111 Kurtosis -0.663824577 Skewness 0.18737027 Range 32 Minimum 25 Maximum 57 Sum 402 Count 10 SATISFACTION Mean 4.3 Standard Error 0.472581563 Median Mode 4 Standard 1.494434118 Deviation Sample Variance 2.233333333 Kurtosis -0.151799637 Skewness 0.359543071 Range 5 Minimum 2 Maximum 7 Sum 43 Count 10 File Formulas Data Revies View Home Insert Page Layout X Cut Calibri Copy Format Painter I Clipboard Font Paste Wrap Test Merge & Cent Alignment 14 INCOME G 1 2 3 4 GENDER SATISFACTIO AGE GENDER (1=male, 2 female INCOME (1-low, 2-medium 3-high) SATISFACTION POLITICAL PARTY (dissatisfied 1234567 satisfied) (1=repub,2-demo, 3-indep m m un r If 5 3 m h 1 f - 3 ir m m r 25 33 36 41 47 57 29 38 44 52 m m f m 4 4 4 6 7 2 1 h Im d d d If m 1. Set up variable columns for the following five variables for a research study about political parties. 2. Then place the values in each column from below. You had 10 people fill out a simple survey for this data. You should have 5 variable columns and 10 rows of data. Numbers 1-10 identify participant rows. Gender: (1) male, (2) female, (3) m, (4) f, (5) m, (6) m, (7) f, (8) f, (9) f, (10) f (Code gender as 1 = male, 2 = female.) Income: (1) medium, (2) low, (3) high, (4) 1, (5) m, (6) m, (7) m, (8) h, (9) m, (10) m (Code income as 1 - low, 2 = medium, 3 = high.) Satisfaction: (1) 5, (2) 5, (3) 3, (4) 3, (5) 4, (6) 4, (7) 4, (8) 6, (9) 7, (10) 2 (Code as dissatisfied 1 2 3 4 5 6 7 satisfied) Political Party: (1) republican, (2) democrat, (3) independent, (4) r, (5) r, (6)r, (7) I, (8) d, (9) d, (10) d (Label 1 = repub. = 2 demo., = 3 indep.) Age: (1)25, (2) 33, (3) 36, (4) 41, (5) 47, (6) 57, (7) 29, (8) 38, (9) 44, (10) 52 (No need to label age scores.) 3. Run the frequencies and descriptive statistics in Excel (see PowerPoint instruction PowerPoints and printed instructions for Excel Add-Ons), present them in tables like the ones below, and complete items 4-7 below, using the statistics. 4. At the same time, make at least one type of graph (pie, bar, histogram) of the data for each variable. 5. Complete the following information from the data item 2 above. Measurement Level # of scales/ groups Appropriate measure of Appropriate measure central tendency of variance/position Variable Gender Income Satisfaction P. Party Age 6. Complete the following information from your descriptive statistics printouts. Mean Median Mode Range Variance S Skew Kurtosis Variable Gender Income Satisfaction P. Party Age 1. Set up variable columns for the following five variables for a research study about political parties. 2. Then place the values in each column from below. You had 10 people fill out a simple survey for this data. You should have 5 variable columns and 10 rows of data. Numbers 1-10 identify participant rows. Gender: (1) male, (2) female, (3) m, (4) f. (5) m, (6) m, (7) f. (8) f. (9) f. (10) f (Code gender as 1 = male, 2 = female.) Income: (1) medium, (2) low, (3) high, (4) 1, (5) m, (6) m, (7) m. (8) h. (9) m. (10) m (Code income as 1 - low, 2 = medium, 3 = high.) Satisfaction: (1) 5.(2)5, (3) 3. (4) 3. (5) 4. (6) 4 (7) 4. (8) 6. (9) 7. (10) 2 (Code as dissatisfied 1 2 3 4 5 6 7 satisfied) Political Party: (1) republican, (2) democrat, (3) independent, (4) r, (5), (6), (7) I, (8) d, (9) d (10) (Label 1 = repub, = 2 demo., = 3 indep) Age: (1) 25. (2) 33, (3) 36, (4) 41, (5) 47, 6) 57. (7) 29 (8) 38, (9) 44 (10) 52 (No need to label age scores.) 3. Run the frequencies and descriptive statistics in Excel (see PowerPoint instruction Power Points and printed instructions for Excel Add-Ons), present them in tables like the ones below, and complete items 4-7 below, using the statistics. 4. At the same time, make at least one type of graph (pie, bar, histogram) of the data for each variable 5. Complete the following information from the data item 2 above
Step by Step Solution
There are 3 Steps involved in it

Get step-by-step solutions from verified subject matter experts