

Question: I need help answering these homework problems for my statistic class. Take a Test - Eliyah Atkins - Google Chrome X mathxl.com/Student/PlayerTest.aspx?testld=219131529¢erwin=yes DAT 473 A
I need help answering these homework problems for my statistic class.
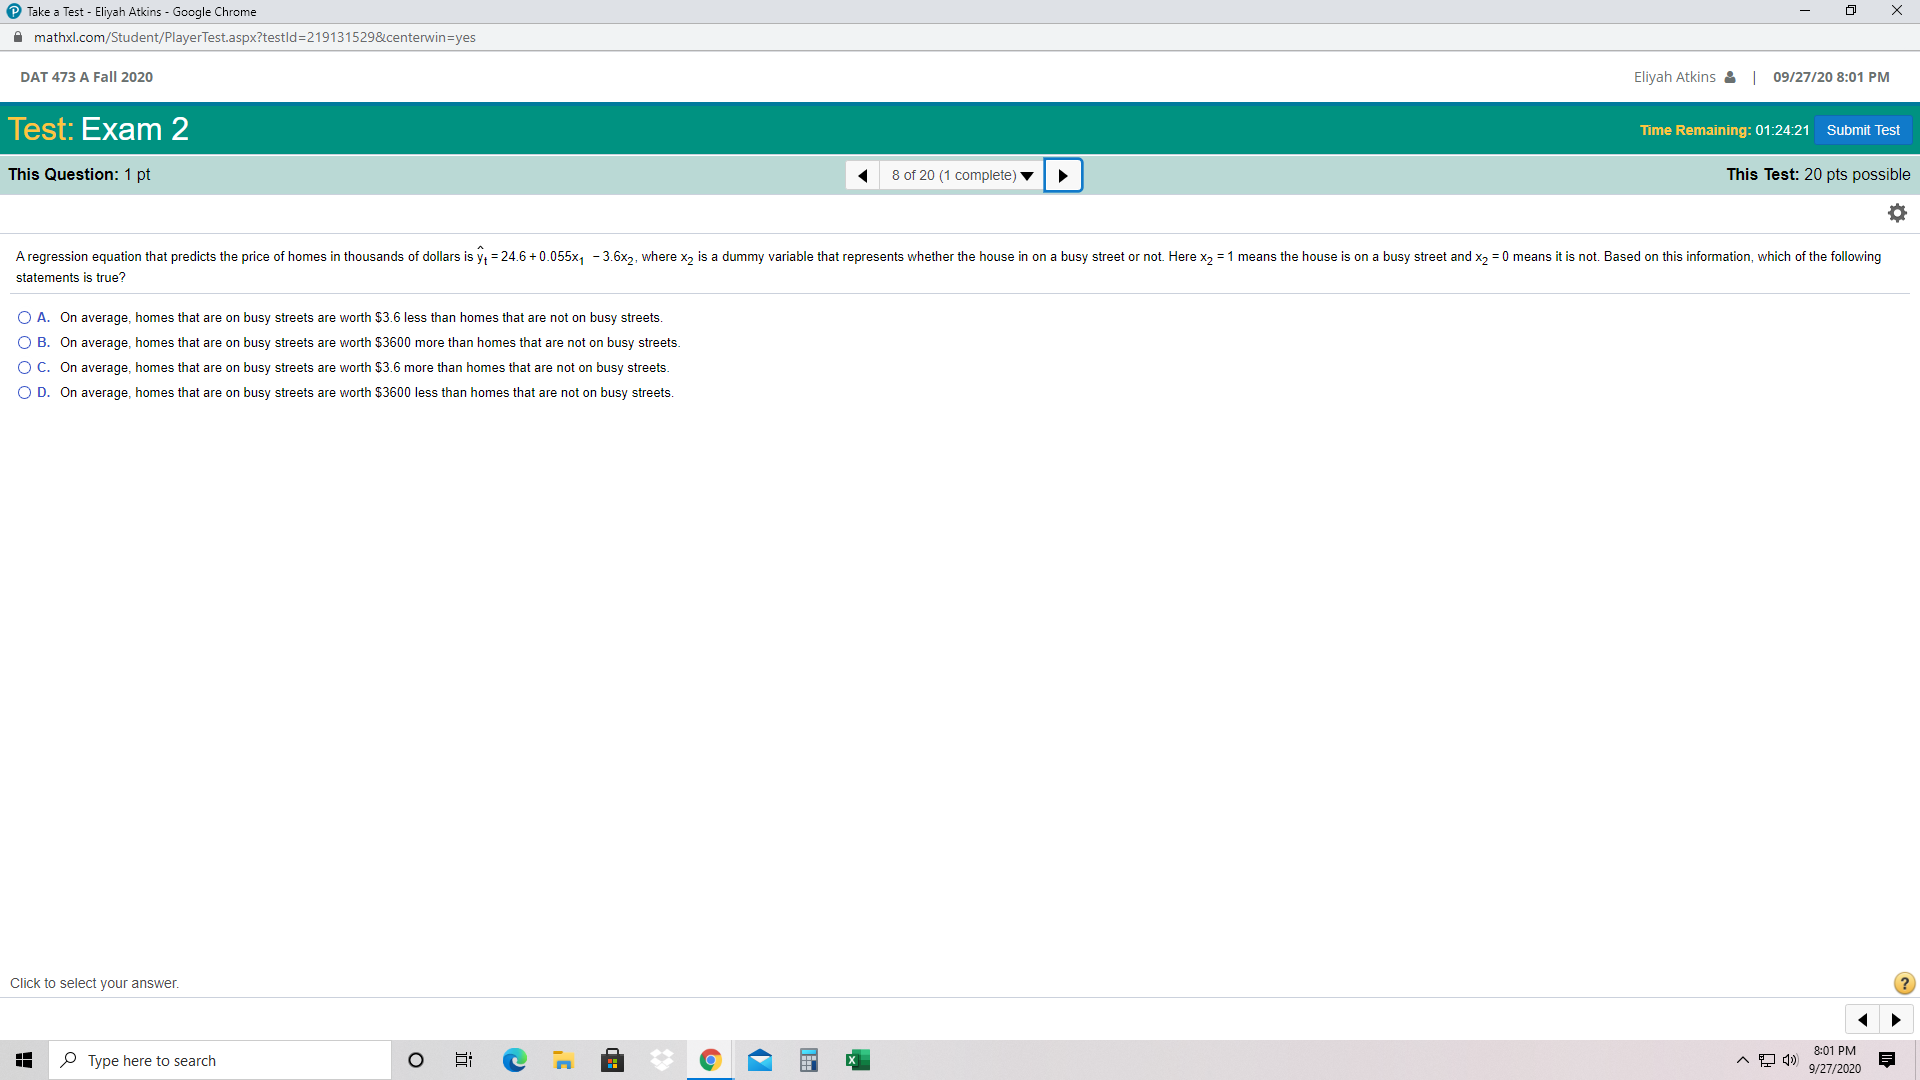
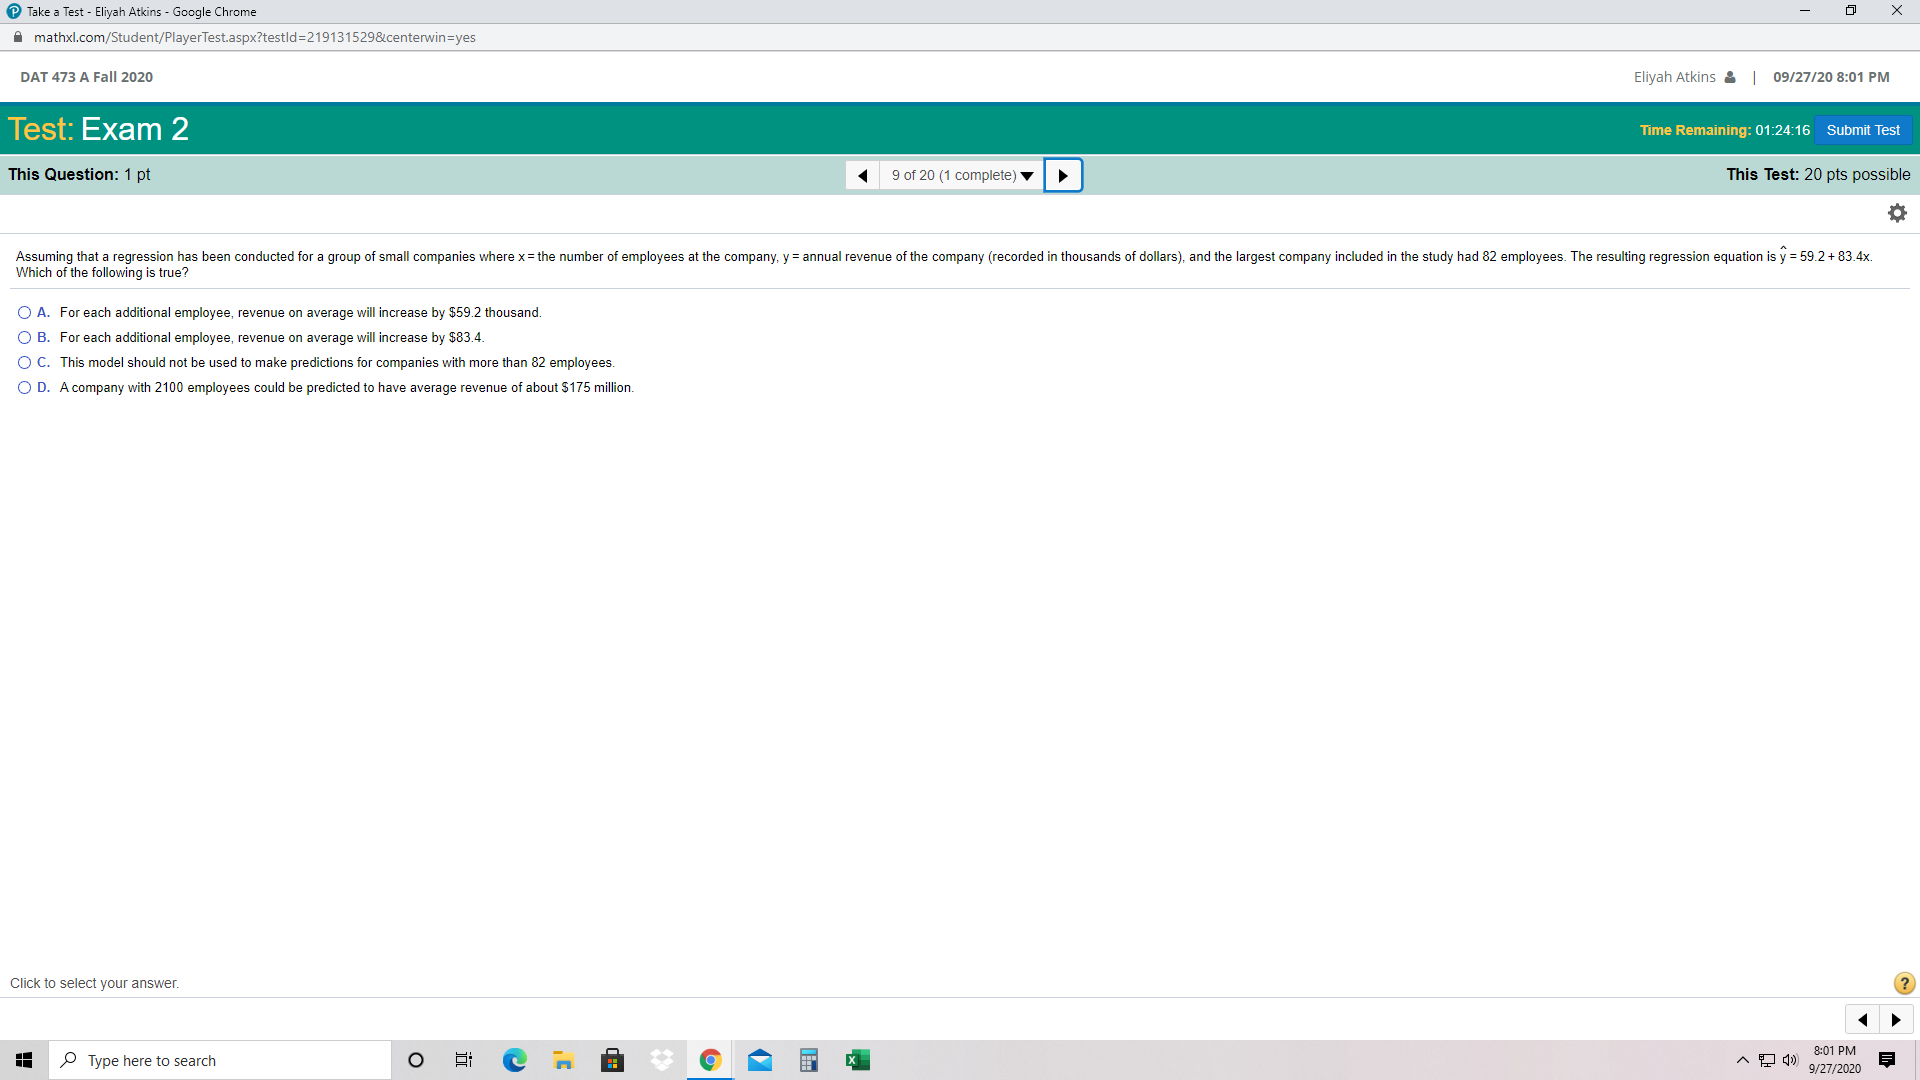
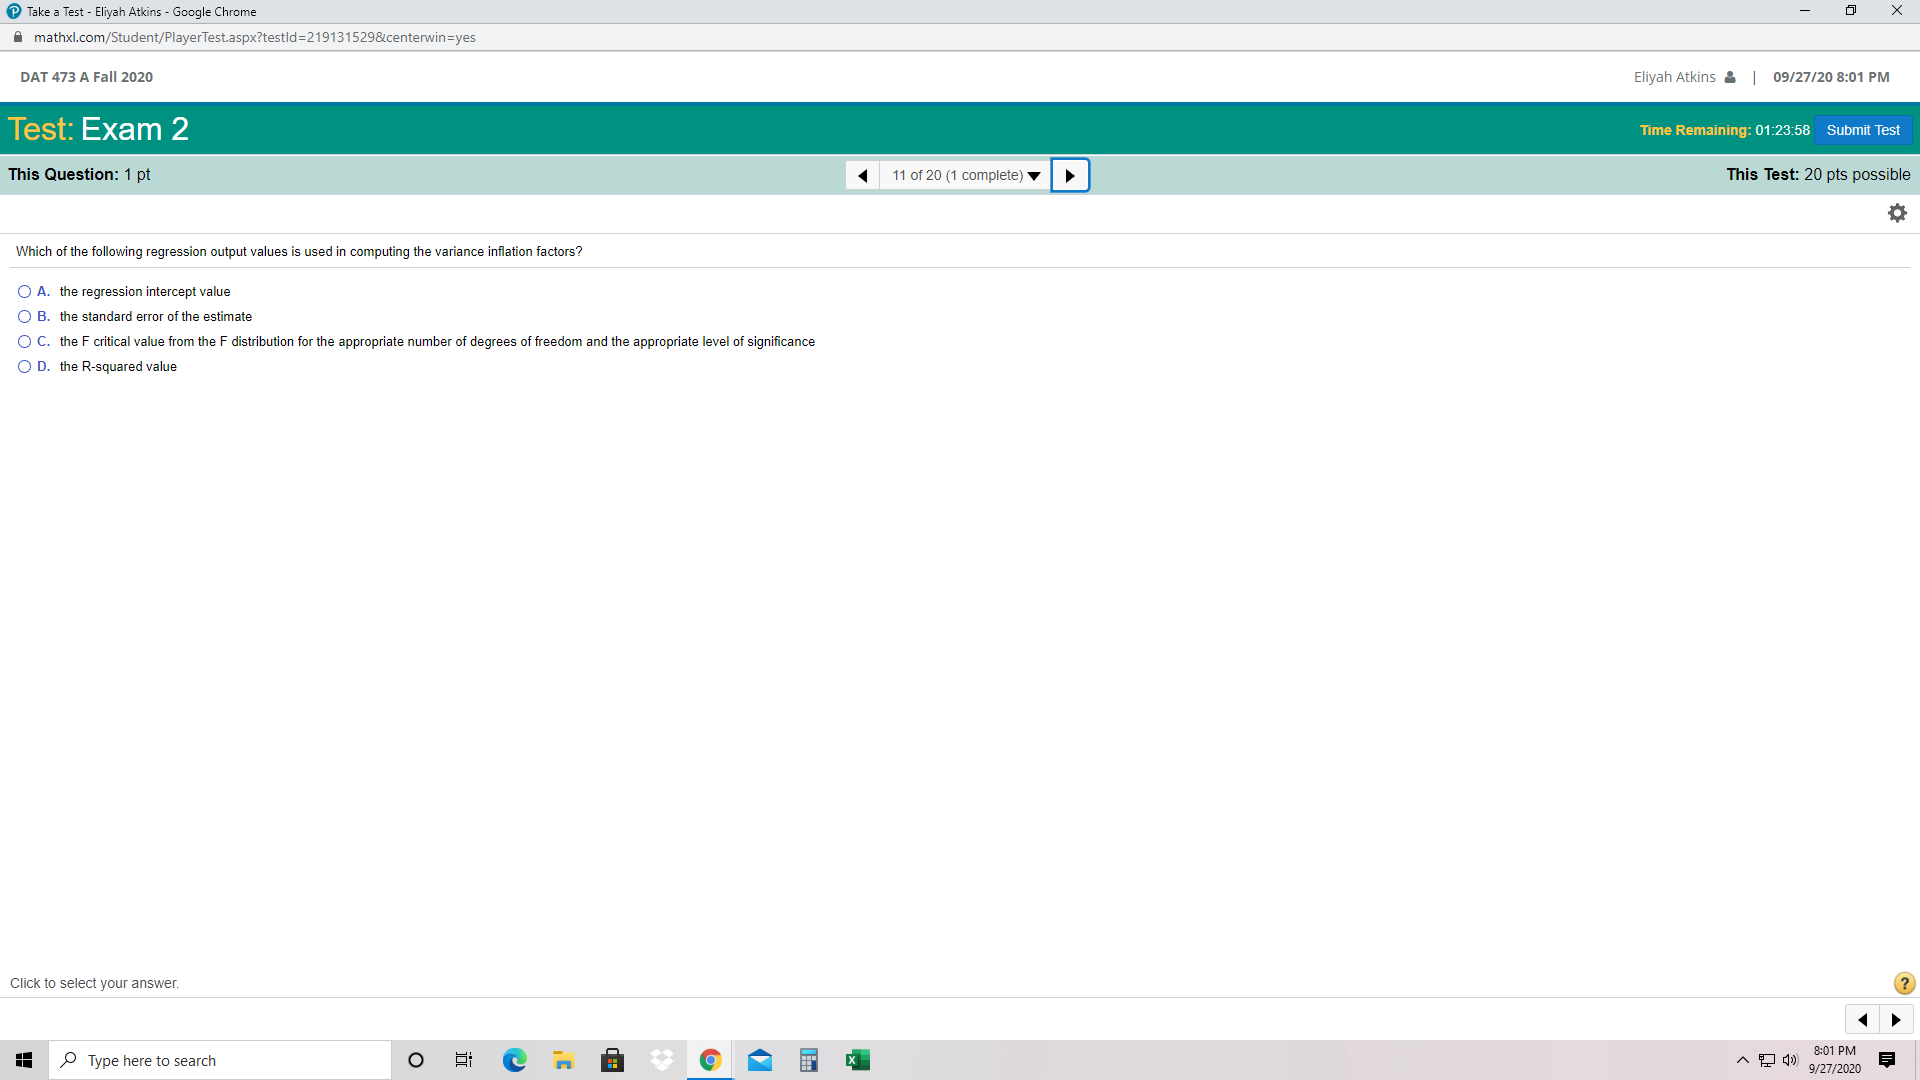
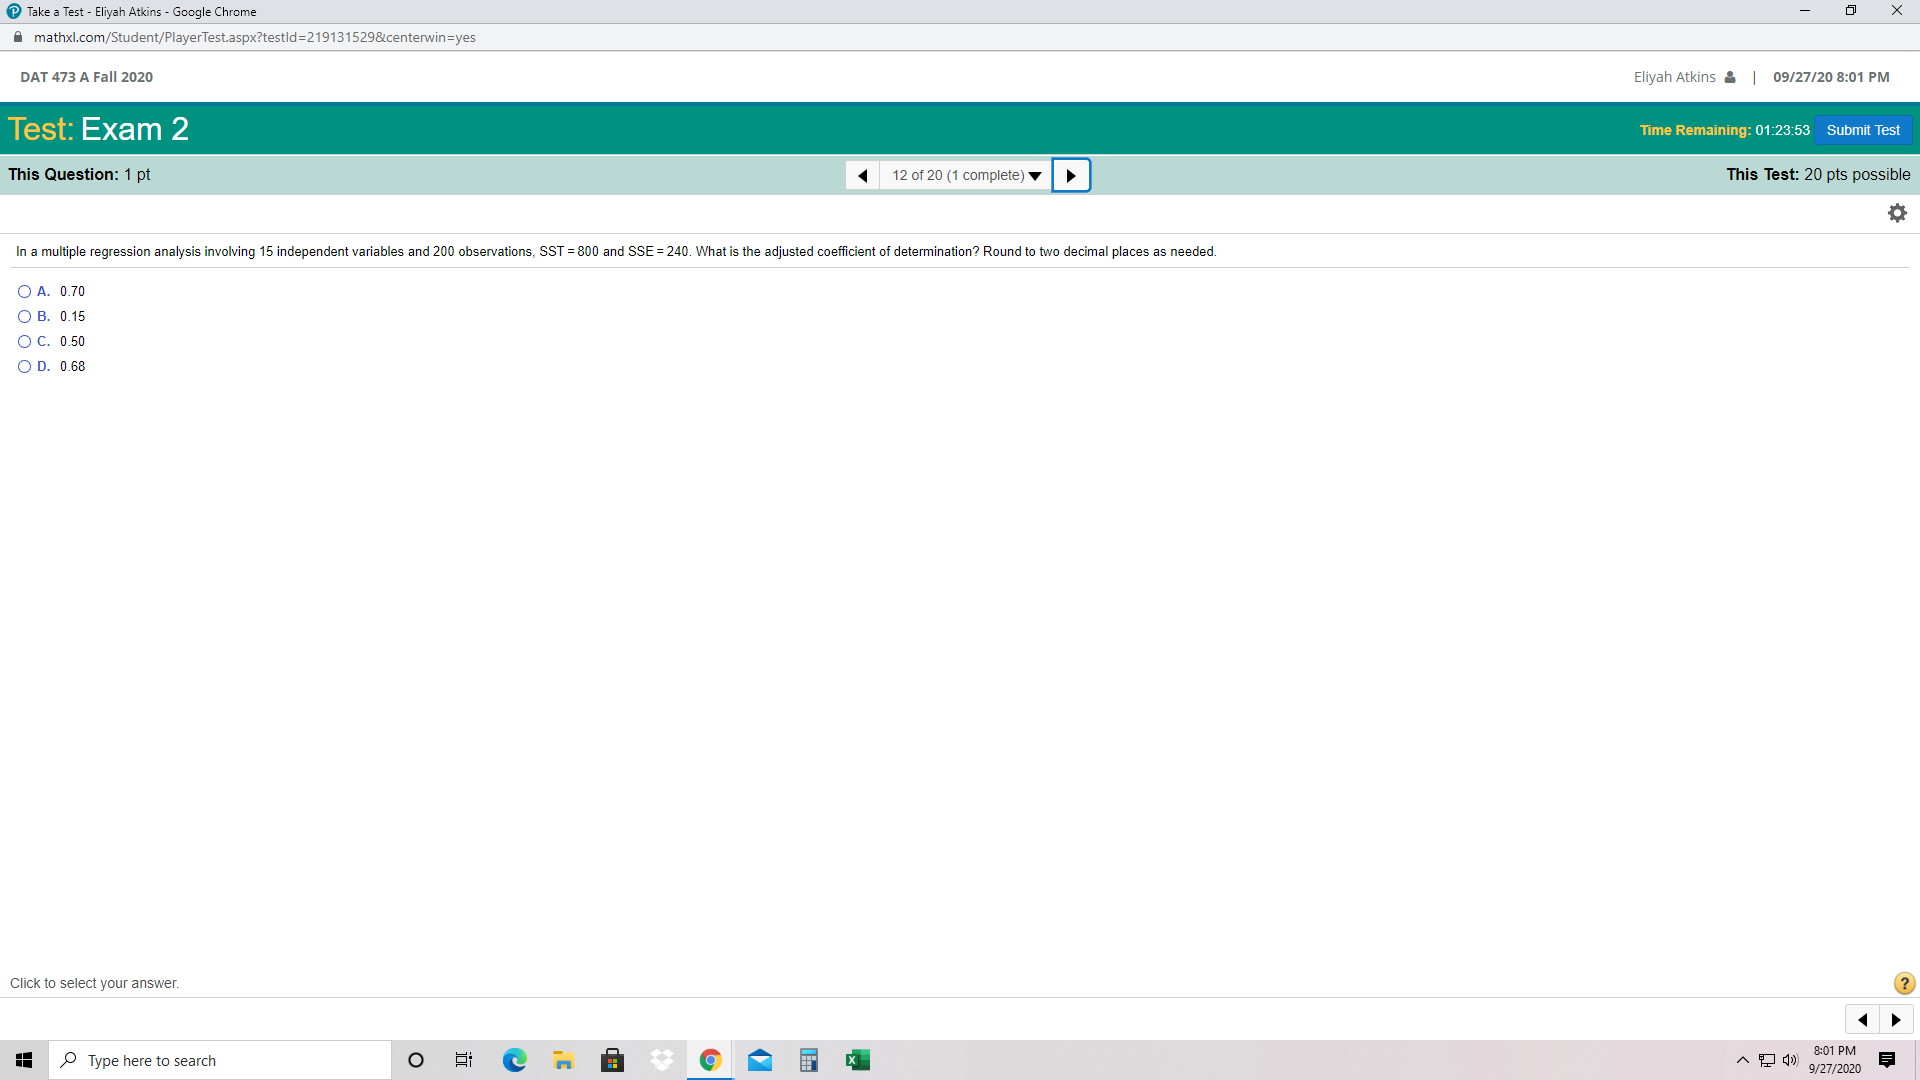
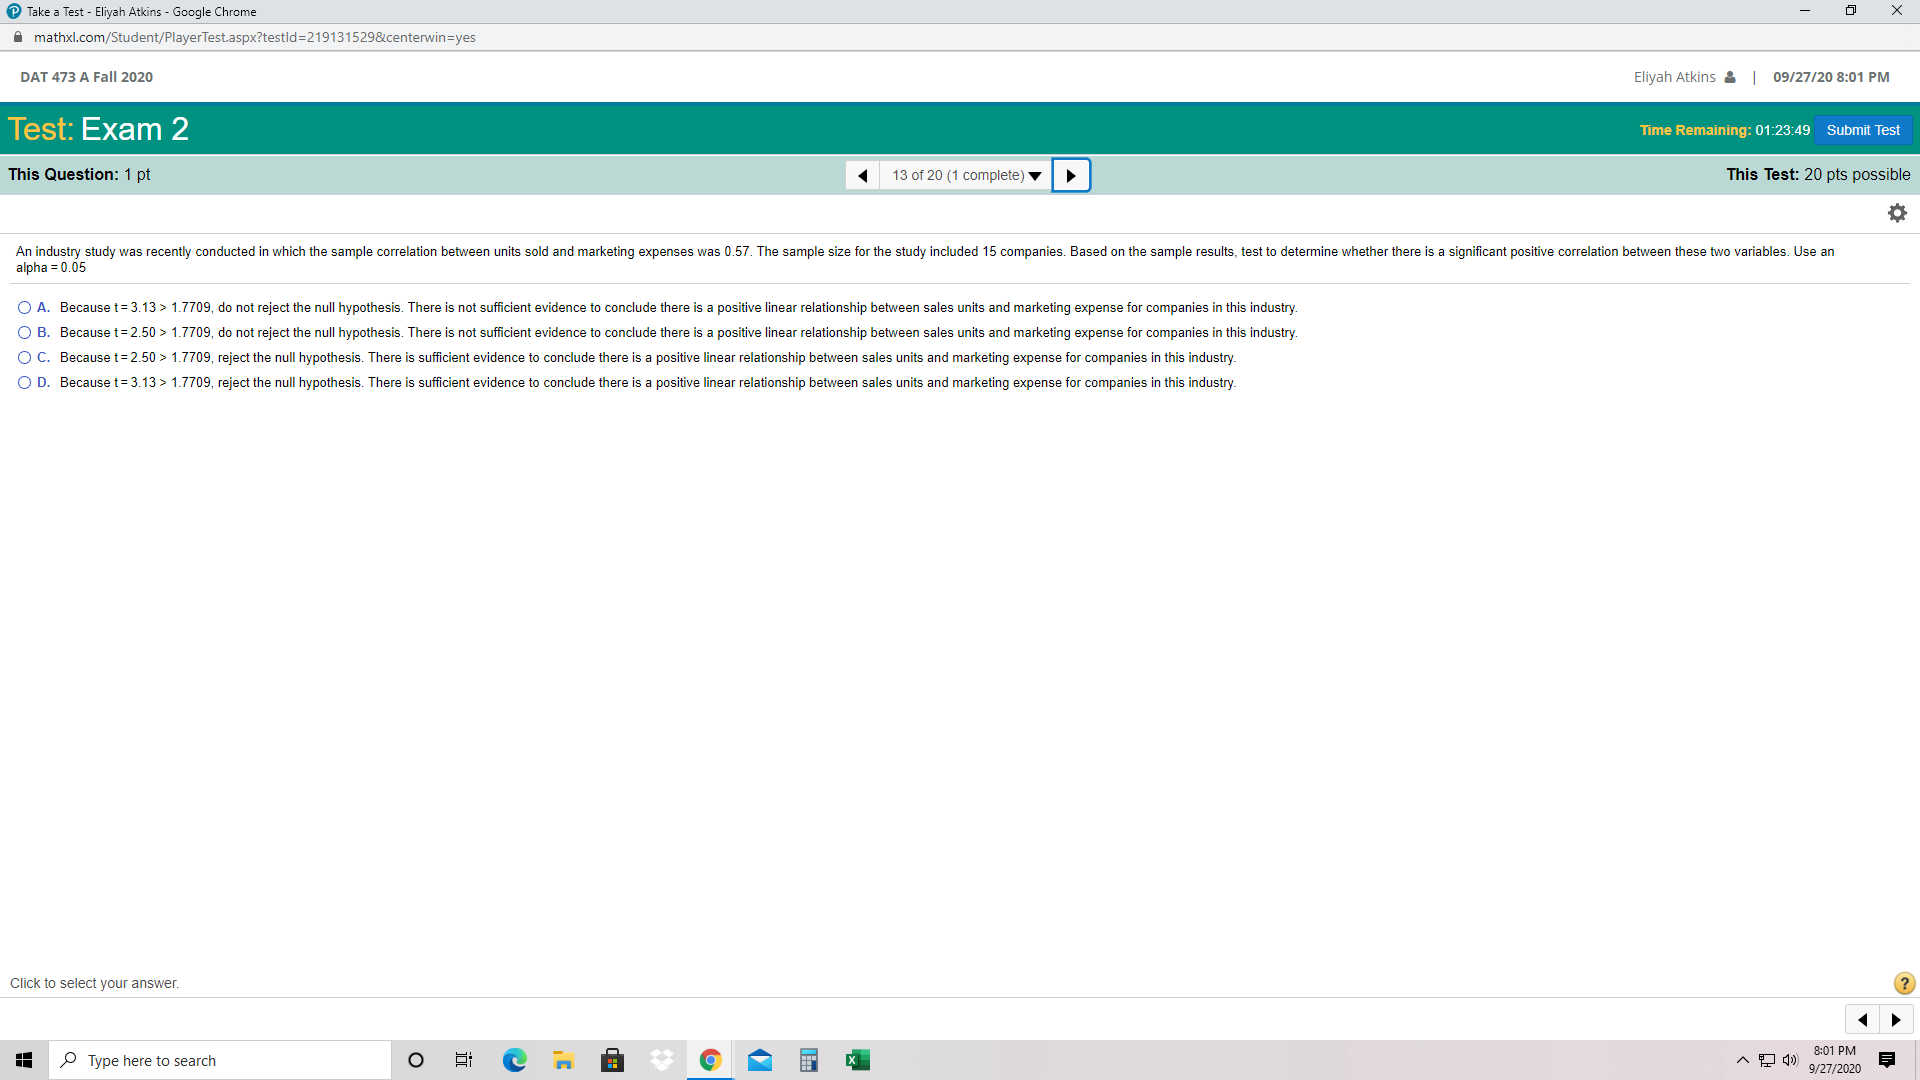
Take a Test - Eliyah Atkins - Google Chrome X mathxl.com/Student/PlayerTest.aspx?testld=219131529¢erwin=yes DAT 473 A Fall 2020 Eliyah Atkins & | 09/27/20 8:01 PM Test: Exam 2 Time Remaining: 01:24:21 Submit Test This Question: 1 pt 4 8 of 20 (1 complete) This Test: 20 pts possible A regression equation that predicts the price of homes in thousands of dollars is y, = 24.6 + 0.055x, -3.6x2, where x2 is a dummy variable that represents whether the house in on a busy street or not. Here x2 = 1 means the house is on a busy street and x2 = 0 means it is not. Based on this information, which of the following statements is true? O A. On average, homes that are on busy streets are worth $3.6 less than homes that are not on busy streets. O B. On average, homes that are on busy streets are worth $3600 more than homes that are not on busy streets. O C. On average, homes that are on busy streets are worth $3.6 more than homes that are not on busy streets. O D. On average, homes that are on busy streets are worth $3600 less than homes that are not on busy streets. Click to select your answer. ? Type here to search 8:01 PM ~'9/27/2020Take a Test - Eliyah Atkins - Google Chrome X mathxl.com/Student/PlayerTest.aspx?testld=219131529¢erwin=yes DAT 473 A Fall 2020 Eliyah Atkins & | 09/27/20 8:01 PM Test: Exam 2 Time Remaining: 01:24:16 Submit Test This Question: 1 pt 4 9 of 20 (1 complete) This Test: 20 pts possible Assuming that a regression has been conducted for a group of small companies where x = the number of employees at the company, y = annual revenue of the company (recorded in thousands of dollars), and the largest company included in the study had 82 employees. The resulting regression equation is y = 59.2 + 83.4x. Which of the following is true? O A. For each additional employee, revenue on average will increase by $59.2 thousand. O B. For each additional employee, revenue on average will increase by $83.4 O C. This model should not be used to make predictions for companies with more than 82 employees. O D. A company with 2100 employees could be predicted to have average revenue of about $175 million. Click to select your answer. ? Type here to search 8:01 PM ~'9/27/2020Take a Test - Eliyah Atkins - Google Chrome X mathxl.com/Student/PlayerTest.aspx?testld=219131529¢erwin=yes DAT 473 A Fall 2020 Eliyah Atkins & | 09/27/20 8:01 PM Test: Exam 2 Time Remaining: 01:23:58 Submit Test This Question: 1 pt 4 11 of 20 (1 complete) This Test: 20 pts possible Which of the following regression output values is used in computing the variance inflation factors? O A. the regression intercept value O B. the standard error of the estimate O C. the F critical value from the F distribution for the appropriate number of degrees of freedom and the appropriate level of significance O D. the R-squared value Click to select your answer. ? Type here to search 8:01 PM ~'9/27/2020Take a Test - Eliyah Atkins - Google Chrome X mathxl.com/Student/PlayerTest.aspx?testld=219131529¢erwin=yes DAT 473 A Fall 2020 Eliyah Atkins & | 09/27/20 8:01 PM Test: Exam 2 Time Remaining: 01:23:53 Submit Test This Question: 1 pt 4 12 of 20 (1 complete) This Test: 20 pts possible In a multiple regression analysis involving 15 independent variables and 200 observations, SST = 800 and SSE = 240. What is the adjusted coefficient of determination? Round to two decimal places as needed. O A. 0.70 O B. 0.15 O C. 0.50 O D. 0.68 Click to select your answer. ? Type here to search 8:01 PM ~'9/27/2020Take a Test - Eliyah Atkins - Google Chrome X mathxl.com/Student/PlayerTest.aspx?testld=219131529¢erwin=yes DAT 473 A Fall 2020 Eliyah Atkins & | 09/27/20 8:01 PM Test: Exam 2 Time Remaining: 01:23:49 Submit Test This Question: 1 pt 4 13 of 20 (1 complete) This Test: 20 pts possible An industry study was recently conducted in which the sample correlation between units sold and marketing expenses was 0.57. The sample size for the study included 15 companies. Based on the sample results, test to determine whether there is a significant positive correlation between these two variables. Use an alpha = 0.05 O A. Because t= 3.13 > 1.7709, do not reject the null hypothesis. There is not sufficient evidence to conclude there is a positive linear relationship between sales units and marketing expense for companies in this industry. O B. Because t= 2.50 > 1.7709, do not reject the null hypothesis. There is not sufficient evidence to conclude there is a positive linear relationship between sales units and marketing expense for companies in this industry. O C. Because t= 2.50 > 1.7709, reject the null hypothesis. There is sufficient evidence to conclude there is a positive linear relationship between sales units and marketing expense for companies in this industry. O D. Because t= 3.13 > 1.7709, reject the null hypothesis. There is sufficient evidence to conclude there is a positive linear relationship between sales units and marketing expense for companies in this industry. Click to select your answer. ? Type here to search 8:01 PM ~'9/27/2020
Step by Step Solution
There are 3 Steps involved in it

Get step-by-step solutions from verified subject matter experts