

Question: I need help answering these questions. Upload HeartRate Exercise data and create a scattered plot chart with X representing weekly exercise hours and Y representing
I need help answering these questions.
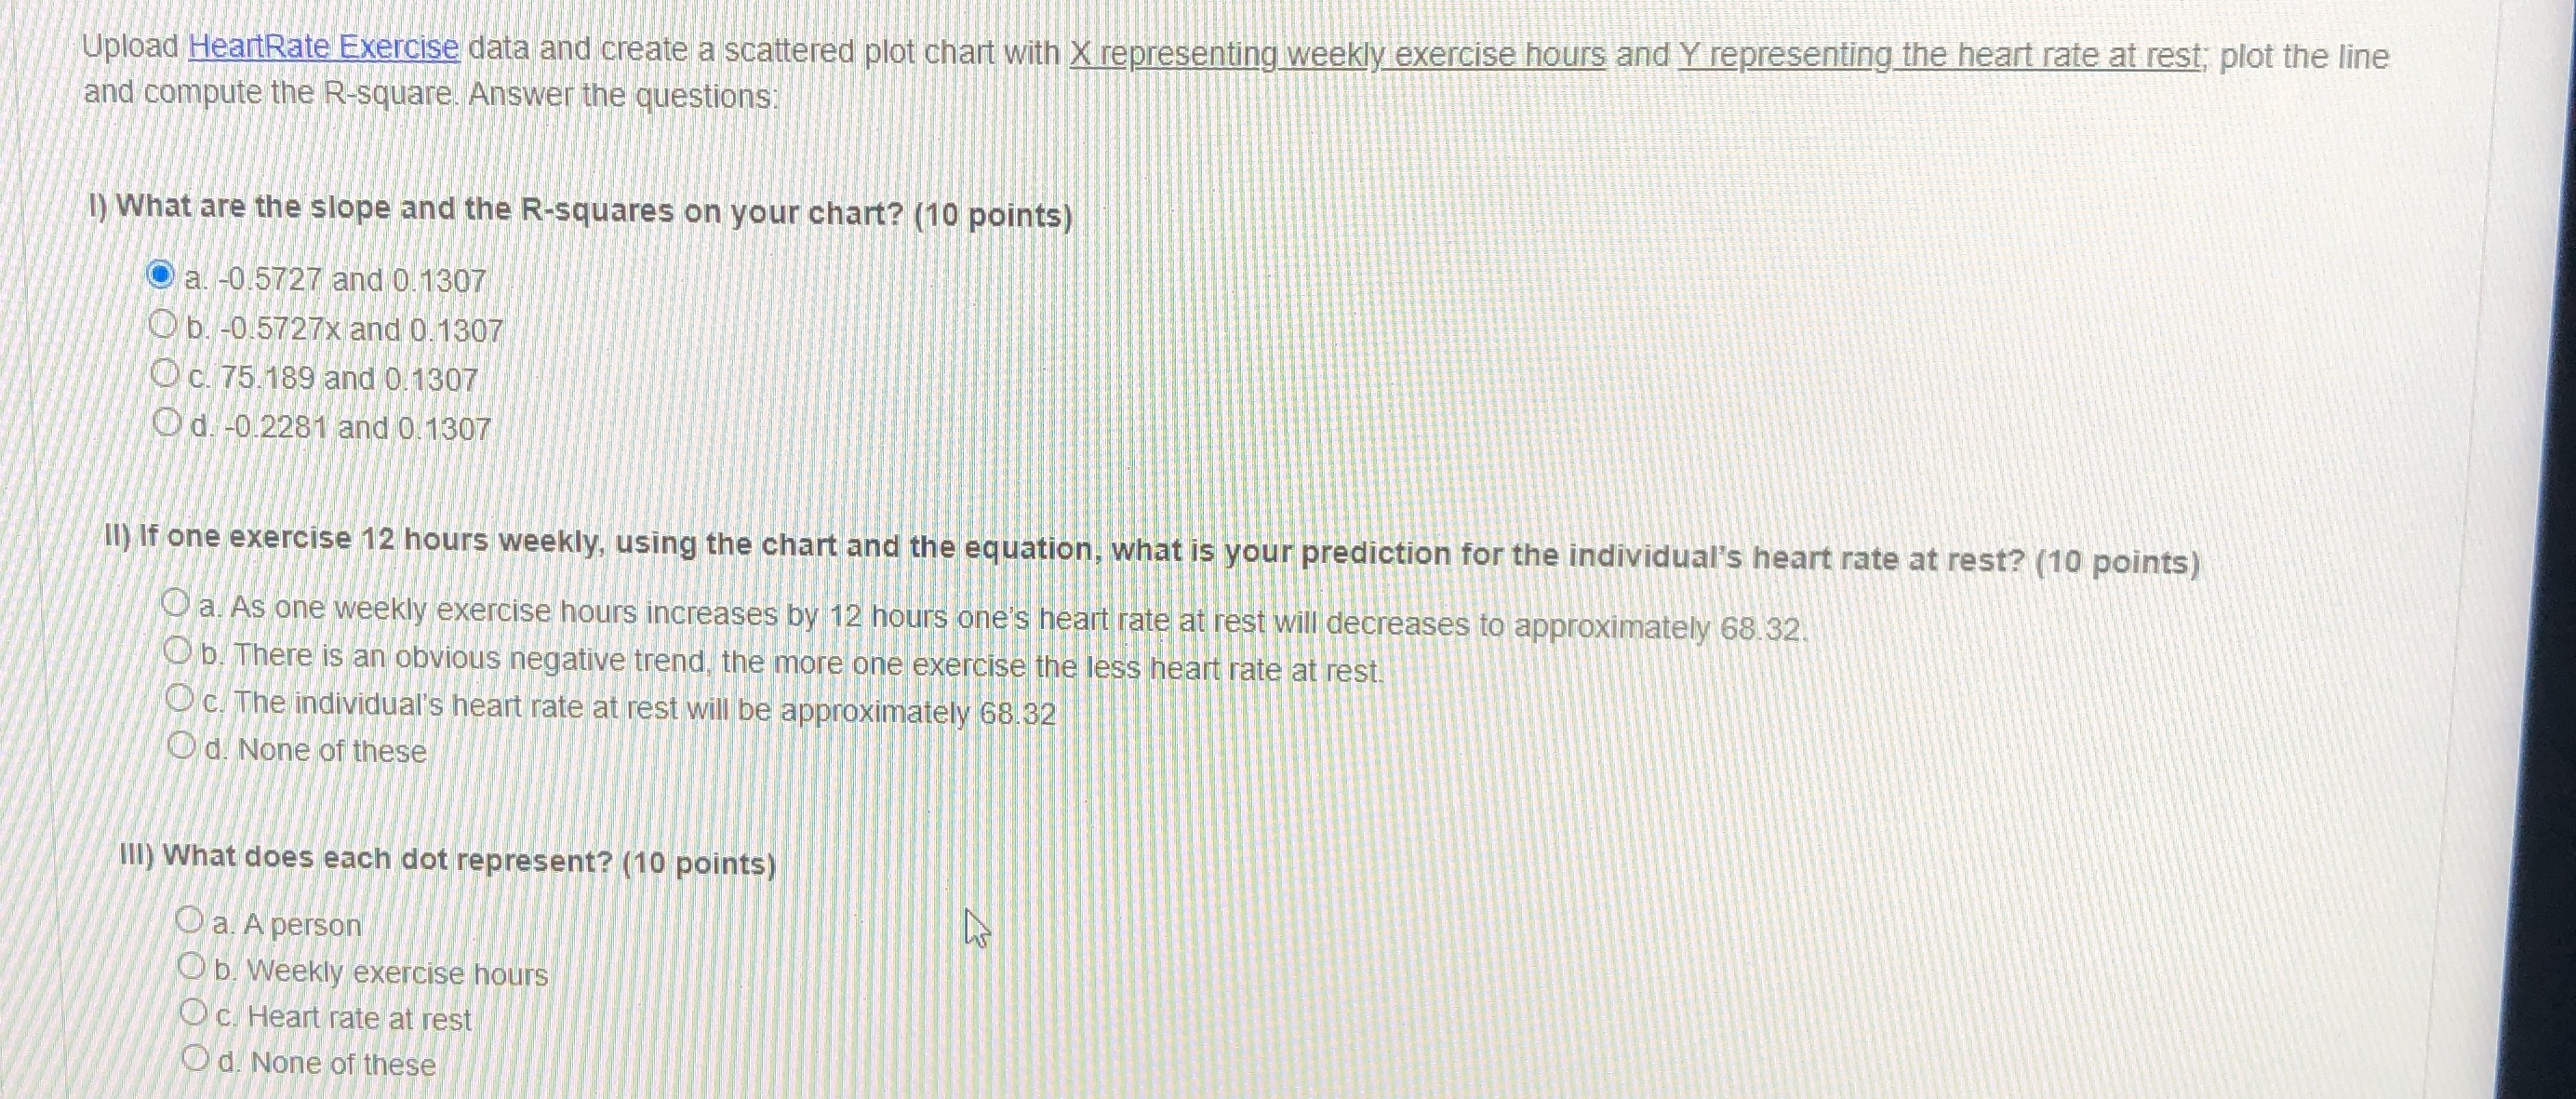
Upload HeartRate Exercise data and create a scattered plot chart with X representing weekly exercise hours and Y representing the heart rate at rest; plot the line and compute the R-square. Answer the questions: I) What are the slope and the R-squares on your chart? (10 points) O a. -0/5727 and 0.1307 @b. -0 5727x and 0.1307 c. 75.189 and 0.1307 Od. -0 2281 and 0.1307 Il) If one exercise 12 hours weekly, using the chart and the equation, what is your prediction for the individual's heart rate at rest? (10 points) O a. As one weekly exercise hours increases by 12 hours one's heart rate at rest will decreases to approximately 68.32. Ob. There is an obvious negative trend, the more one exercise the less heart rate at rest. Oc. The individual's heart rate at rest will be approximately 68.32 Od. None of these Ill) What does each dot represent? (10 points) O a. A person O b. Weekly exercise hours O c. Heart rate at rest O'd. None of these
Step by Step Solution
There are 3 Steps involved in it

Get step-by-step solutions from verified subject matter experts