

Question: I need help answering these two questions. I put the data into excel for the first question to find the T value but I was
I need help answering these two questions. I put the data into excel for the first question to find the "T" value but I was unsure of which number in the displayed equation was the correct number to answer the question. For the second question, I am unsure of how to calculate the new column of numbers using the given equation to get the comparison of y vs. x.
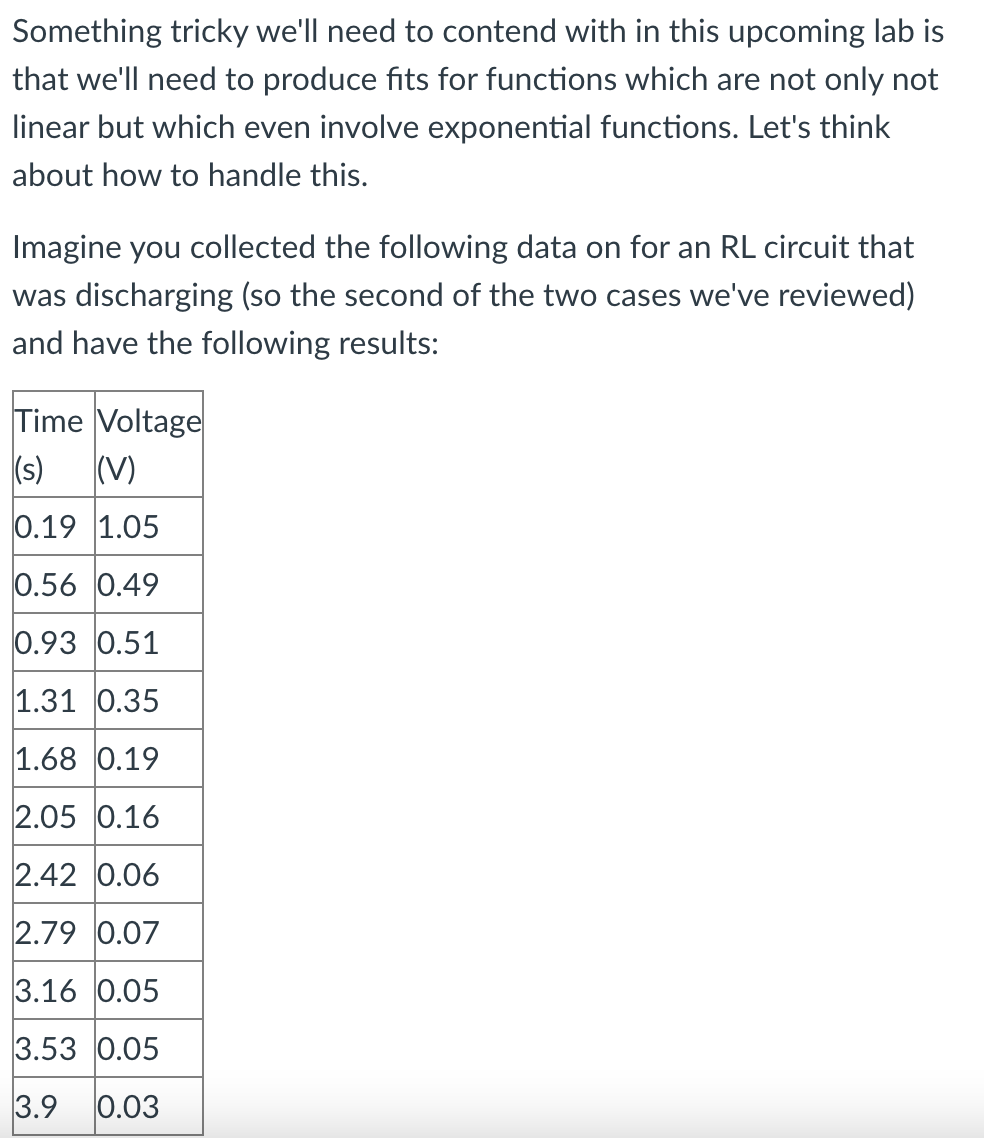
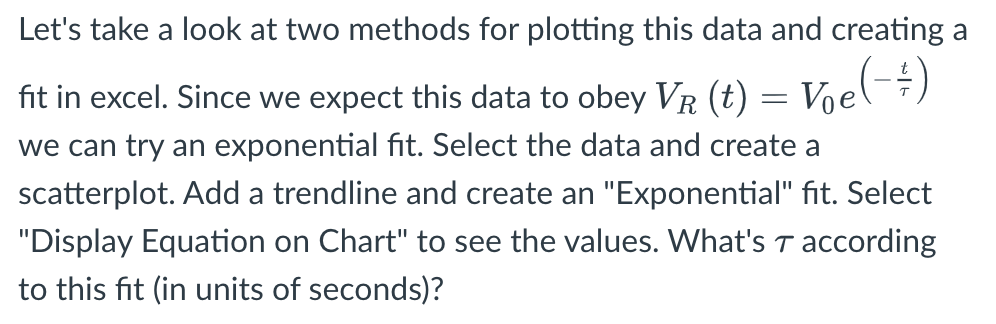
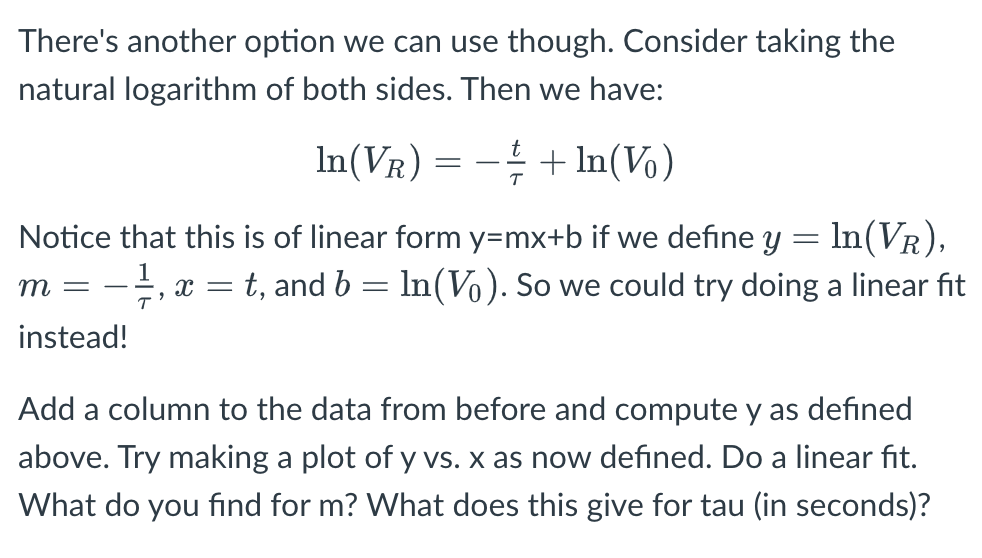
Something tricky we'll need to contend with in this upcoming lab is that we'll need to produce ts for functions which are not only not linear but which even involve exponential functions. Let's think about how to handle this. Imagine you collected the following data on for an RL circuit that was discharging (so the second of the two cases we've reviewed) and have the following results: 0 me Voltage (5) (V) 0.19 1.05 0.56 0.49 0.93 0.51 1.31 0.35 1.68 0.19 2.05 0.16 2.42 2.79 0.07 3.16 0.05 3.53 0.05 3.9 0.03 Let's take a look at two methods for plotting this data and creating a t in excel. Since we expect this data to obey VR (t) = VOA) we can try an exponential t. Select the data and create a scatterplot. Add a trendline and create an "Exponential" t. Select "Display Equation on Chart" to see the values. What's '3" according to this t (in units of seconds)? There's another option we can use though. Consider taking the natural logarithm of both sides. Then we have: In(VR) = + In(Vo) Notice that this is of linear form y=mx+b if we define y = In(VR), m -, x = t, and b = In( Vo ). So we could try doing a linear fit instead! Add a column to the data from before and compute y as defined above. Try making a plot of y vs. x as now defined. Do a linear fit. What do you find for m? What does this give for tau (in seconds)
Step by Step Solution
There are 3 Steps involved in it

Get step-by-step solutions from verified subject matter experts