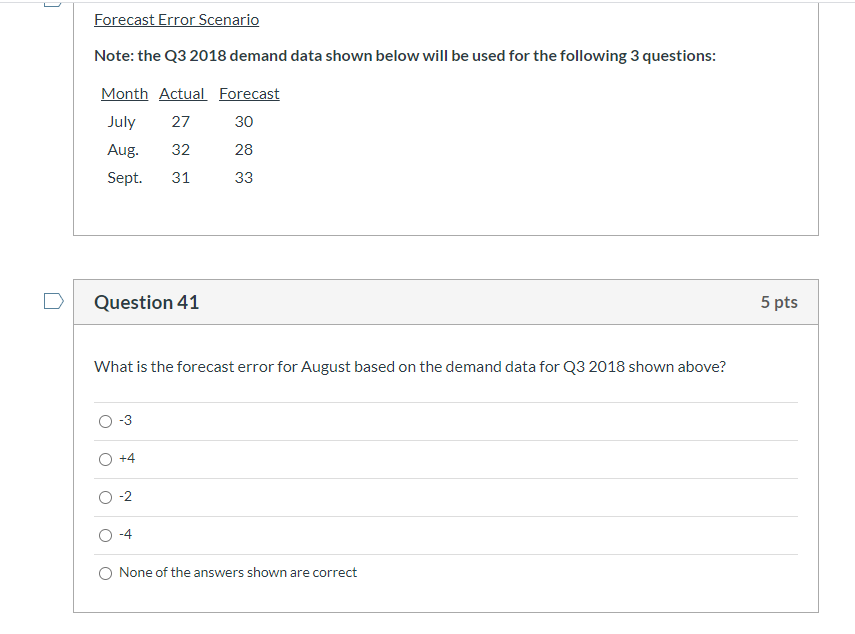
Question: I need help ASAP! Forecast Error Scenario Note: the Q3 2018 demand data shown below will be used for the following 3 questions: 27 Month

I need help ASAP!

I need help ASAP! Forecast Error Scenario Note:

I need help ASAP! Forecast Error Scenario Note:

Forecast Error Scenario Note: the Q3 2018 demand data shown below will be used for the following 3 questions: 27 Month Actual Forecast July 30 Aug. 32 28 Sept. 31 33 Question 41 5 pts What is the forecast error for August based on the demand data for Q3 2018 shown above? +4 O 0 N -4 None of the answers shown are correct Question 42 5 pts What is the MAD for the Q3 2018 data set shown above? 0 10 90 None of the answers shown are correct Question 43 5 pts What is the MAPE for the Q3 2018 data set shown above? 3% O 9% 10% 90% O None of the answers shown are correct

Step by Step Solution

There are 3 Steps involved in it

1 Expert Approved Answer
Step: 1 Unlock blur-text-image
Question Has Been Solved by an Expert!

Get step-by-step solutions from verified subject matter experts

Step: 2 Unlock
Step: 3 Unlock

Students Have Also Explored These Related General Management Questions!