

Question: I need help ASAP with this excel file for Home Depot. Please help if possible. = Ongoing Analysis Template (2).xlsx fx Data Inp... Valuation Sensitivit...
I need help ASAP with this excel file for Home Depot. Please help if possible.
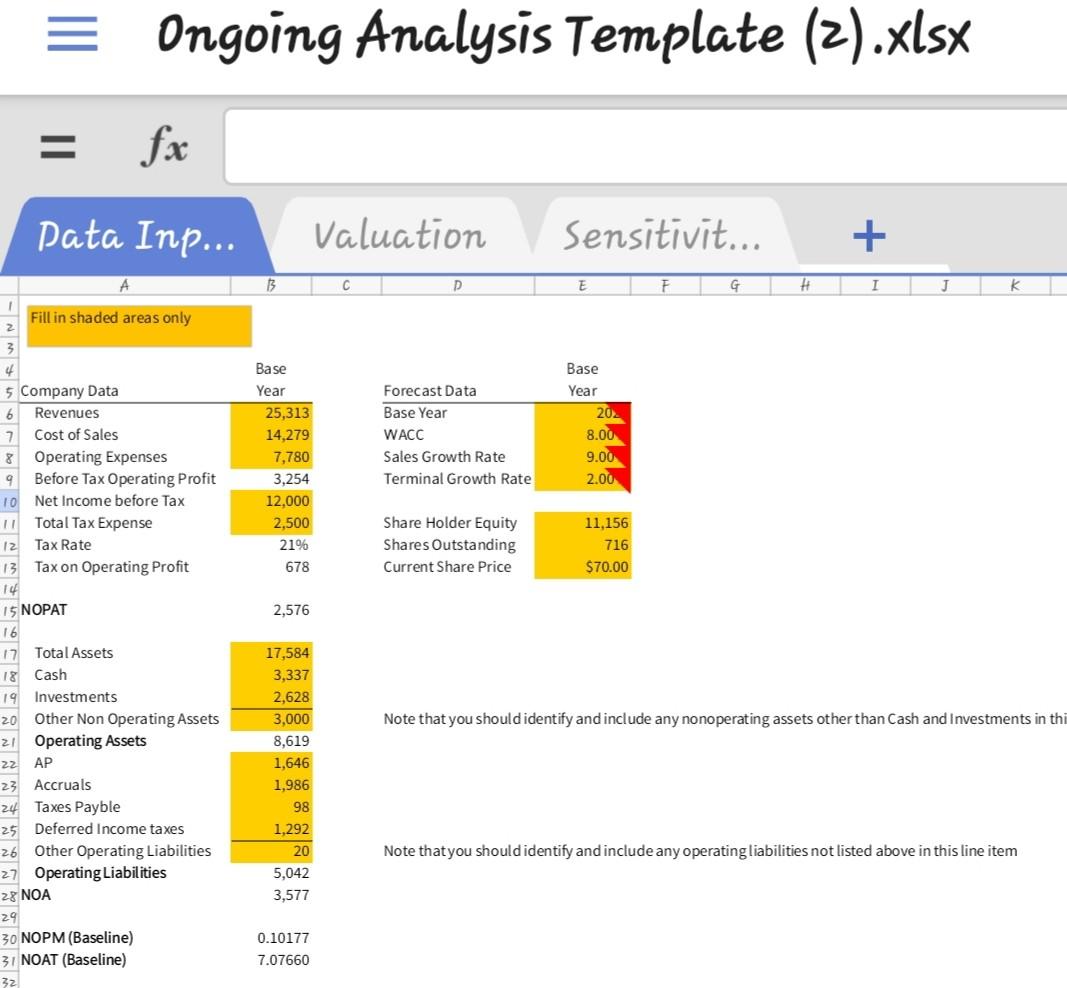
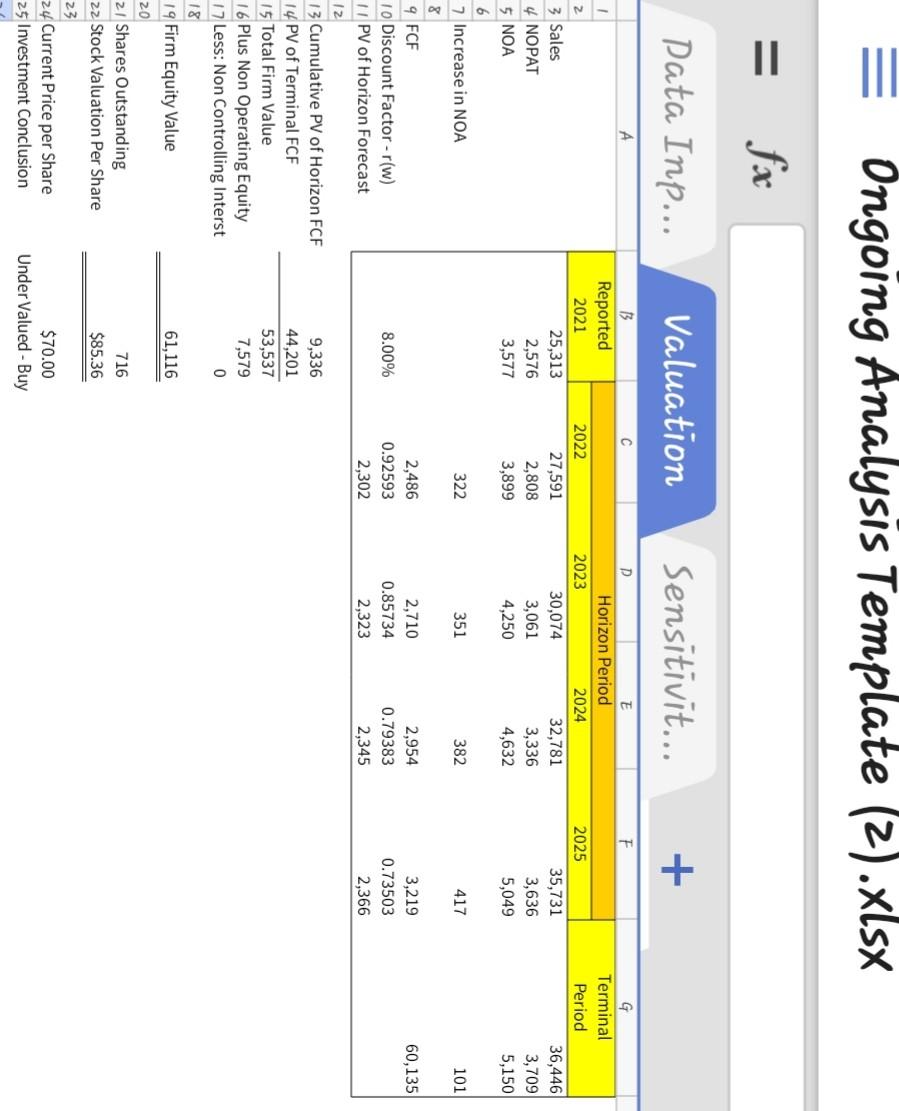
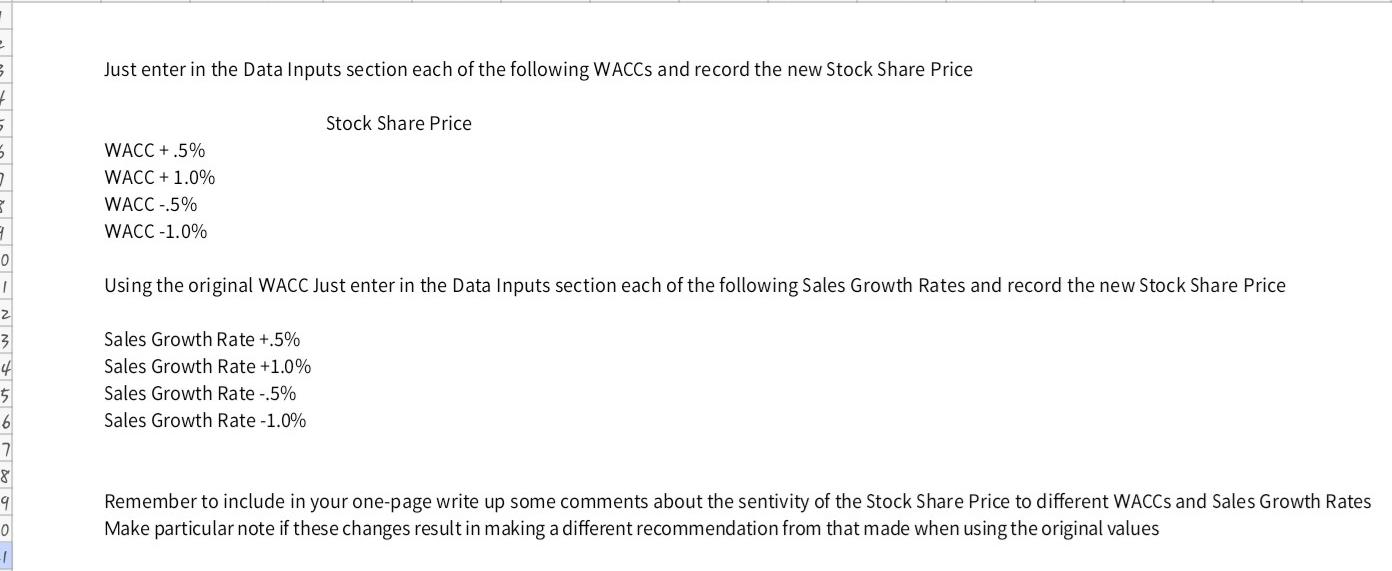
= Ongoing Analysis Template (2).xlsx fx Data Inp... Valuation Sensitivit... + A 13 E F G H I k Fill in shaded areas only Base JOMW Year 25,313 14,279 7,780 3,254 12,000 2,500 21% 678 Forecast Data Base Year WACC Sales Growth Rate Terminal Growth Rate Base Year 202 8.00 9.00 2.00 Share Holder Equity Shares Outstanding Current Share Price 11.156 716 $70.00 2,576 3 4 5 Company Data 6 Revenues 7 Cost of Sales 8 Operating Expenses 9 Before Tax Operating Profit 10 Net Income before Tax II Total Tax Expense 12 Tax Rate 13 Tax on Operating Profit 14 15 NOPAT 16 17 Total Assets 18 Cash 19 Investments 20 Other Non Operating Assets 21 Operating Assets 22 AP 23 Accruals 24 Taxes Payble 25 Deferred Income taxes 26 Other Operating Liabilities 27 Operating Liabilities 28 NOA 29 30 NOPM (Baseline) 31 NOAT (Baseline) 32 Note that you should identify and include any nonoperating assets other than Cash and Investments in thi 17,584 3,337 2,628 3,000 8,619 1,646 1,986 98 1,292 20 5,042 3,577 Note thatyou should identify and include any operating liabilities not listed above in this line item 0.10177 7.07660 III Ongoing Analysis Template (2).xlsx = fx Data Inp... Valuation Sensitivit... + A F B Reported 2021 25,313 2,576 3,577 2022 27,591 2,808 3,899 D E Horizon Period 2023 2024 30,074 32,781 3,061 3,336 4,250 4,632 2025 35,731 3,636 5,049 G Terminal Period 36,446 3,709 5,150 322 351 382 417 101 60,135 2 3 Sales 4 NOPAT 5 NOA 6 7 Increase in NOA 8 9 FCF To Discount Factor-r(w) 1 PV of Horizon Forecast 12 13 Cumulative PV of Horizon FCF 14 PV of Terminal FCF 15 Total Firm Value 16 Plus Non Operating Equity 17 Less: Non Controlling Interst 8.00% 2,486 0.92593 2,302 2,710 0.85734 2,323 2,954 0.79383 2,345 3,219 0.73503 2,366 9,336 44,201 53,537 7,579 0 61,116 19 Firm Equity Value 20 21 Shares Outstanding 22 Stock Valuation Per Share 23 24 Current Price per Share 25 Investment Conclusion 716 $85.36 $70.00 Under Valued - Buy Just enter in the Data Inputs section each of the following WACCs and record the new Stock Share Price Stock Share Price WACC +.5% WACC + 1.0% WACC -.5% WACC -1.0% Using the original WACC Just enter in the Data Inputs section each of the following Sales Growth Rates and record the new Stock Share Price Sales Growth Rate +.5% Sales Growth Rate +1.0% Sales Growth Rate -.5% Sales Growth Rate -1.0% 9 Remember to include in your one-page write up some comments about the sentivity of the Stock Share Price to different WACCs and Sales Growth Rates Make particular note if these changes result in making a different recommendation from that made when using the original values = Ongoing Analysis Template (2).xlsx fx Data Inp... Valuation Sensitivit... + A 13 E F G H I k Fill in shaded areas only Base JOMW Year 25,313 14,279 7,780 3,254 12,000 2,500 21% 678 Forecast Data Base Year WACC Sales Growth Rate Terminal Growth Rate Base Year 202 8.00 9.00 2.00 Share Holder Equity Shares Outstanding Current Share Price 11.156 716 $70.00 2,576 3 4 5 Company Data 6 Revenues 7 Cost of Sales 8 Operating Expenses 9 Before Tax Operating Profit 10 Net Income before Tax II Total Tax Expense 12 Tax Rate 13 Tax on Operating Profit 14 15 NOPAT 16 17 Total Assets 18 Cash 19 Investments 20 Other Non Operating Assets 21 Operating Assets 22 AP 23 Accruals 24 Taxes Payble 25 Deferred Income taxes 26 Other Operating Liabilities 27 Operating Liabilities 28 NOA 29 30 NOPM (Baseline) 31 NOAT (Baseline) 32 Note that you should identify and include any nonoperating assets other than Cash and Investments in thi 17,584 3,337 2,628 3,000 8,619 1,646 1,986 98 1,292 20 5,042 3,577 Note thatyou should identify and include any operating liabilities not listed above in this line item 0.10177 7.07660 III Ongoing Analysis Template (2).xlsx = fx Data Inp... Valuation Sensitivit... + A F B Reported 2021 25,313 2,576 3,577 2022 27,591 2,808 3,899 D E Horizon Period 2023 2024 30,074 32,781 3,061 3,336 4,250 4,632 2025 35,731 3,636 5,049 G Terminal Period 36,446 3,709 5,150 322 351 382 417 101 60,135 2 3 Sales 4 NOPAT 5 NOA 6 7 Increase in NOA 8 9 FCF To Discount Factor-r(w) 1 PV of Horizon Forecast 12 13 Cumulative PV of Horizon FCF 14 PV of Terminal FCF 15 Total Firm Value 16 Plus Non Operating Equity 17 Less: Non Controlling Interst 8.00% 2,486 0.92593 2,302 2,710 0.85734 2,323 2,954 0.79383 2,345 3,219 0.73503 2,366 9,336 44,201 53,537 7,579 0 61,116 19 Firm Equity Value 20 21 Shares Outstanding 22 Stock Valuation Per Share 23 24 Current Price per Share 25 Investment Conclusion 716 $85.36 $70.00 Under Valued - Buy Just enter in the Data Inputs section each of the following WACCs and record the new Stock Share Price Stock Share Price WACC +.5% WACC + 1.0% WACC -.5% WACC -1.0% Using the original WACC Just enter in the Data Inputs section each of the following Sales Growth Rates and record the new Stock Share Price Sales Growth Rate +.5% Sales Growth Rate +1.0% Sales Growth Rate -.5% Sales Growth Rate -1.0% 9 Remember to include in your one-page write up some comments about the sentivity of the Stock Share Price to different WACCs and Sales Growth Rates Make particular note if these changes result in making a different recommendation from that made when using the original values
Step by Step Solution
There are 3 Steps involved in it

Get step-by-step solutions from verified subject matter experts