

Question: I need help calculating the current ratio, quick ratio, long-term debt/equity ratio, and total debt/equity ratio, net profit margin, operating profit margin, return on equity,
I need help calculating the current ratio, quick ratio, long-term debt/equity ratio, and total debt/equity ratio, net profit margin, operating profit margin, return on equity, return on total assets, return on capital employed, inventory turnover, asset turnover rate, price earnings ratio, earnings per share, and net asset value for the company I have listed to statements for below.
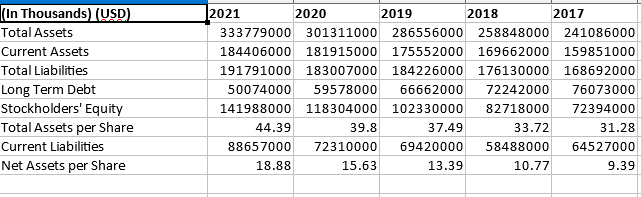
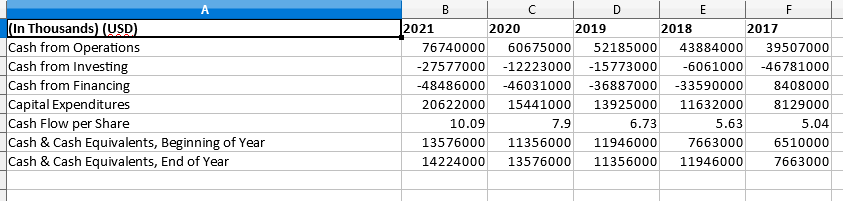
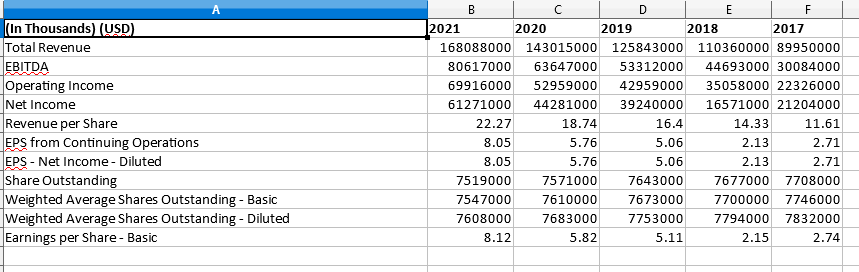
(In Thousands (USD) Total Assets Current Assets Total Liabilities Long Term Debt Stockholders' Equity Total Assets per Share Current Liabilities Net Assets per Share 2021 2020 2019 2018 2017 333779000 301311000 286556000 258848000 241086000 184406000 181915000 175552000 169662000 159851000 191791000 183007000 184226000 176130000 168692000 500 74000 59578000 66662000 72242000 76073000 141988000 118304000 102330000 82718000 72394000 44.39 39.8 37.49 33.72 31.28 88657000 72310000 69420000 58488000 64527000 18.88 15.63 13.39 10.77 9.39 A (In Thousands (USD) Cash from Operations Cash from Investing Cash from Financing Capital Expenditures Cash Flow per Share Cash & Cash Equivalents, Beginning of Year Cash & Cash Equivalents, End of Year B D E F 2021 2020 2019 2018 2017 76740000 60675000 52185000 43884000 39507000 -27577000 -12223000 -15773000 -6061000 -46781000 -48486000 -46031000 -36887000 -33590000 8408000 20622000 15441000 13925000 11632000 8129000 10.09 7.9 6.73 5.63 5.04 13576000 11356000 11946000 7663000 6510000 14224000 13576000 11356000 11946000 7663000 (In Thousands) (USD Total Revenue EBITDA Operating Income Net Income Revenue per Share EPS from Continuing Operations EPS - Net Income - Diluted Share Outstanding Weighted Average Shares Outstanding - Basic Weighted Average Shares Outstanding - Diluted Earnings per Share - Basic B C D E F 2021 2020 2019 2018 2017 168088000 143015000 125843000 110360000 89950000 80617000 63647000 53312000 44693000 30084000 69916000 52959000 42959000 35058000 22326000 61271000 44281000 39240000 16571000 21204000 22.27 18.74 16.4 14.33 11.61 8.05 5.76 5.06 2.13 2.71 8.05 5.76 5.06 2.13 2.71 7519000 7571000 7643000 7677000 7708000 7547000 7610000 7673000 7700000 7746000 7608000 7683000 7753000 7794000 7832000 8.12 5.82 5.11 2.15 2.74 (In Thousands (USD) Total Assets Current Assets Total Liabilities Long Term Debt Stockholders' Equity Total Assets per Share Current Liabilities Net Assets per Share 2021 2020 2019 2018 2017 333779000 301311000 286556000 258848000 241086000 184406000 181915000 175552000 169662000 159851000 191791000 183007000 184226000 176130000 168692000 500 74000 59578000 66662000 72242000 76073000 141988000 118304000 102330000 82718000 72394000 44.39 39.8 37.49 33.72 31.28 88657000 72310000 69420000 58488000 64527000 18.88 15.63 13.39 10.77 9.39 A (In Thousands (USD) Cash from Operations Cash from Investing Cash from Financing Capital Expenditures Cash Flow per Share Cash & Cash Equivalents, Beginning of Year Cash & Cash Equivalents, End of Year B D E F 2021 2020 2019 2018 2017 76740000 60675000 52185000 43884000 39507000 -27577000 -12223000 -15773000 -6061000 -46781000 -48486000 -46031000 -36887000 -33590000 8408000 20622000 15441000 13925000 11632000 8129000 10.09 7.9 6.73 5.63 5.04 13576000 11356000 11946000 7663000 6510000 14224000 13576000 11356000 11946000 7663000 (In Thousands) (USD Total Revenue EBITDA Operating Income Net Income Revenue per Share EPS from Continuing Operations EPS - Net Income - Diluted Share Outstanding Weighted Average Shares Outstanding - Basic Weighted Average Shares Outstanding - Diluted Earnings per Share - Basic B C D E F 2021 2020 2019 2018 2017 168088000 143015000 125843000 110360000 89950000 80617000 63647000 53312000 44693000 30084000 69916000 52959000 42959000 35058000 22326000 61271000 44281000 39240000 16571000 21204000 22.27 18.74 16.4 14.33 11.61 8.05 5.76 5.06 2.13 2.71 8.05 5.76 5.06 2.13 2.71 7519000 7571000 7643000 7677000 7708000 7547000 7610000 7673000 7700000 7746000 7608000 7683000 7753000 7794000 7832000 8.12 5.82 5.11 2.15 2.74
Step by Step Solution
There are 3 Steps involved in it

Get step-by-step solutions from verified subject matter experts