

Question: I need help calculating the Regression Results for the graph. I can do it myself. I just need to know what to put in the
I need help calculating the Regression Results for the graph. I can do it myself. I just need to know what to put in the excel regression data analysis tool. What goes into the Y and X part?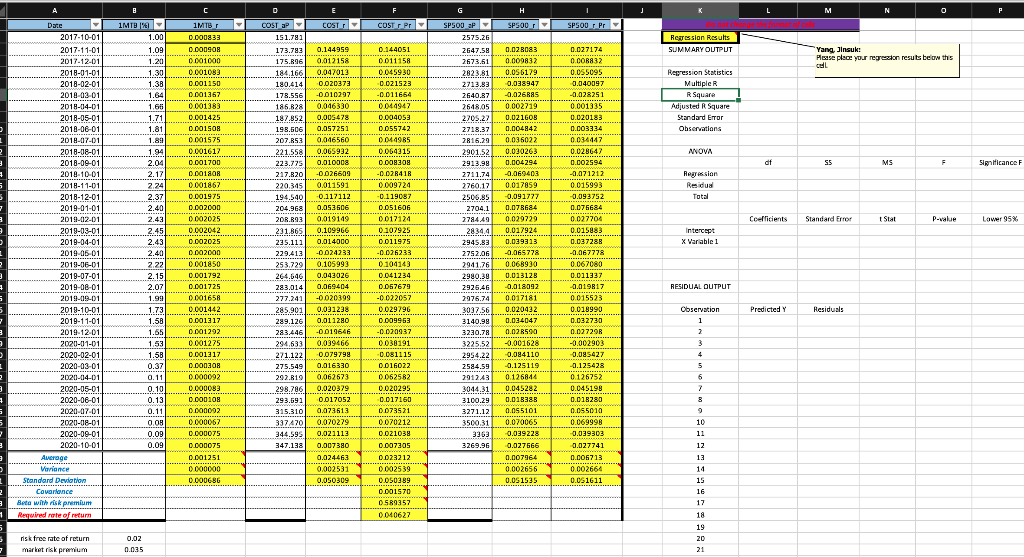
D J L M N O F COSTCOSTEPP H SPSOD SPSOU r Pr Regression Results SUMMARY OUTPUT 1MTS T 0.000833 0.000908 0001000 0.001083 0.001150 0.001357 0.001383 0.001425 0.00150R 0.144959 0.012158 ---- 0.047013 0.020373 Yang, Jinsuki Please place your regression resut be on this CEL ... .. 0.028083 0.009832 0.056179 ************ 0.038947 -0.026R8S 0.002719 0.02190E 0.004842 0.036022 0.030263 0.004294 Regression Statistics Multiple R Square Adjusted R Square Standard Error Observations COST P 151.781 173.783 175.R16 184.166 180.414 178.556 186,828 187,852 198.506 207.R53 221.558 223.775 217.820 220,345 194.540 204.9GE 20RR93 231.865. 235.111 ANNOVA df SS MS F F Sanicance F IMIDE- 1.00 1.09 1.20 1.30 1.38 1.64 1.66 1.71 1.81 1.89 1.94 2.04 2.17 2.24 2.37 2.40 2.43 2.45 2.43 2.40 2.22 2.15 2.07 1.99 1.73 1.58 1.65 1.53 1.5B Regression Residual Total Coefficients 0.144051 0011158 ---- 0.045930 0.021523 -0.011654 .......... 0044947 0.004053 0.055742 0044985 0.064315 0.008308 -0.028418 0.009724 -0.119087 0051606 0017124 0.107925 0011975 -0.026233 .... 0.104143 0.041234 0.057679 -0.022057 0.029796 0.009953 -0.020937 .. 0038191 -0.081115 0.016022 Standard Error SPSOU SP 2575.26 2647.58 . 2673.61 2823.81 2713.83 2640.87 2648.05 2205,22 2718.37 2R16.29 2901.52 2913.99 2711.74 2760.17 2506.85 2704.1 2784.49 2834.4 2945.83 2752.06 2941.76 2980.39 292546 2976.74 3037.56 3140.99 3230.78 3225.52 2954.22 2584.59 291243 3044.31 3100.29 3271.12 Stal Date 2017-10-01 2017-11-01 2017-12-01 2018-01-01 2018-02-01 2018-03-01 2018-04-01 2018-05-01 2018-06-01 2018-07-01 2018-08-01 2018-09-01 2018-10-01 2018-11-01 2018-12-01 2019-01-01 2019-012-01 2019-03-01 2019-04-01 2019-06-01 2019-06-01 2019-07-01 2019-08-01 2019-09-01 2019-10-01 2019-11-01 2019-12-01 2020-01-01 2020-02-01 2020-03-01 2020-04-01 2020-05-01 2020-06-01 2020-07-01 2020-08-01 2020-09-01 2020-10-01) Average Variance Standard Deviation Covariance Beta with risk premium Required role of return P- P-value Lower 95% Intercept X Variable 1 -0.010297 0.046330 0.005478 0.057252 0.016560 0.065932 0.010008 -0.026600 0.011591 -0.117112 0.052506 0.019149 0.109966 0.014000 -0.024233 0.105993 0.043026 0.069404 ....... -0.020399 0.031238 0.011280 -0.019646 0.039466 0.079798 0.016330 0.062673 0.020379 0.017052 0.073613 0.020279 ************ 0.021113 0.007380 -0.069403 0.017059 -0.091777 0.078684 0.029729 0.017924 0.039313 -0.065778 0.068930 0.013128 -0.01809 0001575 0.001617 0.001700 0.001SOR 0.001867 0.001975 0.002000 0002025 0.002042 0.002025 0.002000 0001850 we 0.001792 0.001725 0001658 0.001442 0.001317 0.001292 0.001275 0.001317 0.000308 0000092 0.000083 0.000108 0.00000 0.000067 0.000075 0.000075 0.001251 0.000000 0.0006BG --- 0.027174 0.00R832 0.055095 0.040097 -0.028251 0.001335 0.020183 0.003334 0.034447 0.028647 0.002594 -0.071212 0.015993 -0.093752 0.075684 0.027700 0.015883 0.037288 -0.067778 0.067080 0.011337 -0.019817 0.015523 0.018990 0.032730 0.02729R -0.002903 -0.08542 -0.125428 0.126752 0.045198 0.018280 0.055010 0.069998 -0.039302 -0.027741 0.006713 0.002664 0.051611 RESIDUAL OUTPUT 0.017181 229.413 253.729 264.646 283.014 277.241 285.901 289.126 283.446 294,633 271.122 275.549 292.R19 298.286. 293.591 315,310 337470 344.595 347.138 Predicted y Residuals Observation 1 2 3 4 5 6 0.37 0.11 0.10 0.13 0.11 0.08 0.09 0.09 0.020432 0.034047 0.02R590 -0.001628 -0.094110 -0.125119 0.125844 0.045282 0.018388 0.055101 . 0.070065 -0.039228 0.027566 0.007964 0.002656 0.051535 8 9 3500.31 0062582 0.020295 0.017160 0.073521 ---- 0.070212 0.021038 0.007305 0.023212 . 0.002539 0.050389 0.001570 OSR9357 000627 10 11 3363 3269.96 12 13 0.024463 ..... 0.002531 0.050309 14 15 16 17 18 19 20 21 0.02 risk free rate of return market risk premium 0.035 D J L M N O F COSTCOSTEPP H SPSOD SPSOU r Pr Regression Results SUMMARY OUTPUT 1MTS T 0.000833 0.000908 0001000 0.001083 0.001150 0.001357 0.001383 0.001425 0.00150R 0.144959 0.012158 ---- 0.047013 0.020373 Yang, Jinsuki Please place your regression resut be on this CEL ... .. 0.028083 0.009832 0.056179 ************ 0.038947 -0.026R8S 0.002719 0.02190E 0.004842 0.036022 0.030263 0.004294 Regression Statistics Multiple R Square Adjusted R Square Standard Error Observations COST P 151.781 173.783 175.R16 184.166 180.414 178.556 186,828 187,852 198.506 207.R53 221.558 223.775 217.820 220,345 194.540 204.9GE 20RR93 231.865. 235.111 ANNOVA df SS MS F F Sanicance F IMIDE- 1.00 1.09 1.20 1.30 1.38 1.64 1.66 1.71 1.81 1.89 1.94 2.04 2.17 2.24 2.37 2.40 2.43 2.45 2.43 2.40 2.22 2.15 2.07 1.99 1.73 1.58 1.65 1.53 1.5B Regression Residual Total Coefficients 0.144051 0011158 ---- 0.045930 0.021523 -0.011654 .......... 0044947 0.004053 0.055742 0044985 0.064315 0.008308 -0.028418 0.009724 -0.119087 0051606 0017124 0.107925 0011975 -0.026233 .... 0.104143 0.041234 0.057679 -0.022057 0.029796 0.009953 -0.020937 .. 0038191 -0.081115 0.016022 Standard Error SPSOU SP 2575.26 2647.58 . 2673.61 2823.81 2713.83 2640.87 2648.05 2205,22 2718.37 2R16.29 2901.52 2913.99 2711.74 2760.17 2506.85 2704.1 2784.49 2834.4 2945.83 2752.06 2941.76 2980.39 292546 2976.74 3037.56 3140.99 3230.78 3225.52 2954.22 2584.59 291243 3044.31 3100.29 3271.12 Stal Date 2017-10-01 2017-11-01 2017-12-01 2018-01-01 2018-02-01 2018-03-01 2018-04-01 2018-05-01 2018-06-01 2018-07-01 2018-08-01 2018-09-01 2018-10-01 2018-11-01 2018-12-01 2019-01-01 2019-012-01 2019-03-01 2019-04-01 2019-06-01 2019-06-01 2019-07-01 2019-08-01 2019-09-01 2019-10-01 2019-11-01 2019-12-01 2020-01-01 2020-02-01 2020-03-01 2020-04-01 2020-05-01 2020-06-01 2020-07-01 2020-08-01 2020-09-01 2020-10-01) Average Variance Standard Deviation Covariance Beta with risk premium Required role of return P- P-value Lower 95% Intercept X Variable 1 -0.010297 0.046330 0.005478 0.057252 0.016560 0.065932 0.010008 -0.026600 0.011591 -0.117112 0.052506 0.019149 0.109966 0.014000 -0.024233 0.105993 0.043026 0.069404 ....... -0.020399 0.031238 0.011280 -0.019646 0.039466 0.079798 0.016330 0.062673 0.020379 0.017052 0.073613 0.020279 ************ 0.021113 0.007380 -0.069403 0.017059 -0.091777 0.078684 0.029729 0.017924 0.039313 -0.065778 0.068930 0.013128 -0.01809 0001575 0.001617 0.001700 0.001SOR 0.001867 0.001975 0.002000 0002025 0.002042 0.002025 0.002000 0001850 we 0.001792 0.001725 0001658 0.001442 0.001317 0.001292 0.001275 0.001317 0.000308 0000092 0.000083 0.000108 0.00000 0.000067 0.000075 0.000075 0.001251 0.000000 0.0006BG --- 0.027174 0.00R832 0.055095 0.040097 -0.028251 0.001335 0.020183 0.003334 0.034447 0.028647 0.002594 -0.071212 0.015993 -0.093752 0.075684 0.027700 0.015883 0.037288 -0.067778 0.067080 0.011337 -0.019817 0.015523 0.018990 0.032730 0.02729R -0.002903 -0.08542 -0.125428 0.126752 0.045198 0.018280 0.055010 0.069998 -0.039302 -0.027741 0.006713 0.002664 0.051611 RESIDUAL OUTPUT 0.017181 229.413 253.729 264.646 283.014 277.241 285.901 289.126 283.446 294,633 271.122 275.549 292.R19 298.286. 293.591 315,310 337470 344.595 347.138 Predicted y Residuals Observation 1 2 3 4 5 6 0.37 0.11 0.10 0.13 0.11 0.08 0.09 0.09 0.020432 0.034047 0.02R590 -0.001628 -0.094110 -0.125119 0.125844 0.045282 0.018388 0.055101 . 0.070065 -0.039228 0.027566 0.007964 0.002656 0.051535 8 9 3500.31 0062582 0.020295 0.017160 0.073521 ---- 0.070212 0.021038 0.007305 0.023212 . 0.002539 0.050389 0.001570 OSR9357 000627 10 11 3363 3269.96 12 13 0.024463 ..... 0.002531 0.050309 14 15 16 17 18 19 20 21 0.02 risk free rate of return market risk premium 0.035
Step by Step Solution
There are 3 Steps involved in it

Get step-by-step solutions from verified subject matter experts