Question: ** I Need help ccmpleting this questions using excel spreadsheet - please attach the needed formulas for each box and how to do below thank
** I Need help ccmpleting this questions using excel spreadsheet - please attach the needed formulas for each box and how to do below thank you **
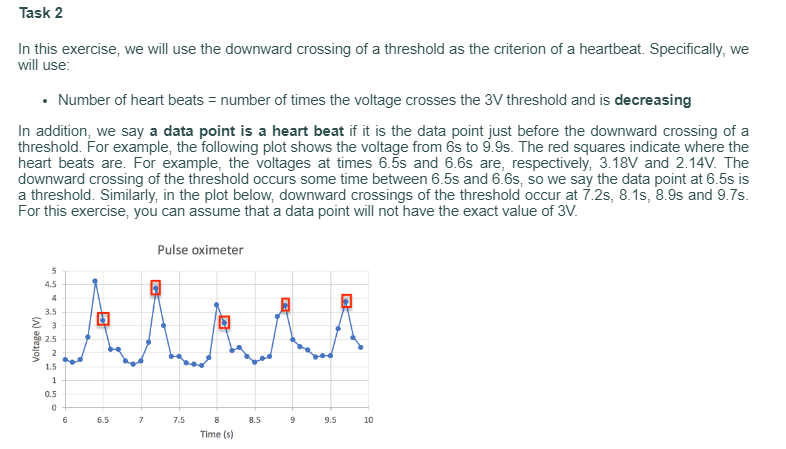
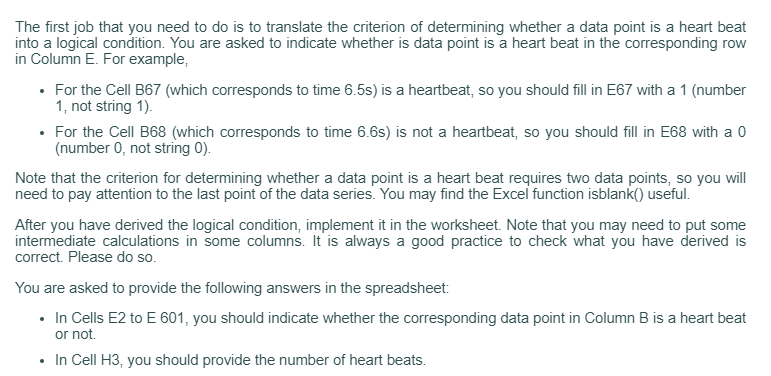
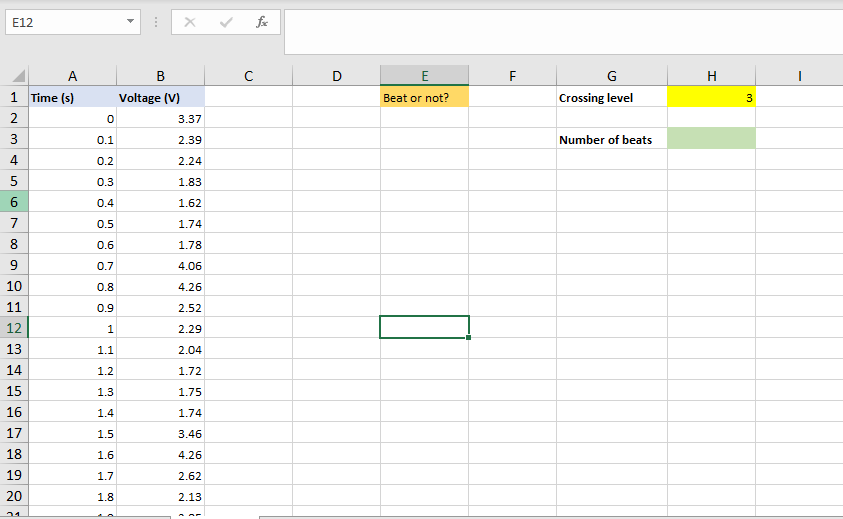
Part B: Counting heart beats The worksheet Heart_Beat contains 2 columns of data obtained from a pulse oximeter sensor. Column A contains the times in seconds) at which the measurements were taken. Column B is the voltage (in Volts) measured at the corresponding time in Column A. For example, at Row number 16, the data were collected at time 1.4s (Cell A16) with a measured voltage of 1.74V (Cell B16). In Online Video 6, we counted the number of beats by counting the number of peaks whose value exceeds a threshold. In this exercise, you will use a different method to determine the number of heart beats. The first step of data analysis is very often to plot the data. Plot the voltage (y-axis) versus time (x-axis). Choose a line type so that you can see the oscillatory pattern of the heart beats. After plotting the graph, you can see that number of heart beats is fairly large. You can manually count them (if you really want to) but it is easy to make a mistake. What you really want to is to get the computer to count them for you. Task 1 We will be using a threshold voltage of 3V. We have specified this value in Cell H1. In this task, you should define a named constant called "threshold" for Cell H1. In Task 2, you should use the named constant "threshold" instead of the value of 3. This will make the context clearer. Task 2 In this exercise, we will use the downward crossing of a threshold as the criterion of a heartbeat. Specifically, we will use: Number of heart beats = number of times the voltage crosses the 3V threshold and is decreasing In addition, we say a data point is a heart beat if it is the data point just before the downward crossing of a threshold. For example, the following plot shows the voltage from 6s to 9.9s. The red squares indicate where the heart beats are. For example, the voltages at times 6.55 and 6.6s are, respectively, 3.18V and 2.14V. The downward crossing of the threshold occurs some time between 6.55 and 6.6s, so we say the data point at 6.5s is a threshold. Similarly, in the plot below, downward crossings of the threshold occur at 1 2s, 8.15, 8.98 and 9.75. For this exercise, you can assume that a data point will not have the exact value of 3V. Pulse oximeter 5 4.5 4 3.5 3 we 2.5 2 1.5 1 0.5 0 6 6.5 7 7.5 8 8.5 9 9.5 10 Time (s) The first job that you need to do is to translate the criterion of determining whether a data point is a heart beat into a logical condition. You are asked to indicate whether is data point is a heart beat in the corresponding row in Column E. For example, For the Cell B67 (which corresponds to time 6.5s) is a heartbeat, so you should fill in E67 with a 1 (number 1, not string 1). For the Cell B68 (which corresponds to time 6.65) is not a heartbeat, so you should fill in E68 with a 0 (number 0, not string 0). Note that the criterion for determining whether a data point is a heart beat requires two data points, so you will need to pay attention to the last point of the data series. You may find the Excel function isblank() useful. After you have derived the logical condition, implement it in the worksheet. Note that you may need to put some intermediate calculations in some columns. It is always a good practice to check what you have derived is correct. Please do so. You are asked to provide the following answers in the spreadsheet: In Cells E2 to E 601, you should indicate whether the corresponding data point in Column B is a heart beat or not In Cell H3, you should provide the number of heart beats. E12 X fic D F. H H B Voltage (V) 0 3.37 E Beat or not? 1 Time (s) 2. 3 G Crossing level 3 N 0.1 2.39 Number of beats 3 4 0.2 2.24 0.3 1.83 5 6 0.4 1.62 7 0.5 1.74 00 0.6 1.78 9 0.7 4.06 0.8 4.26 0.9 2.52 1 2.29 1.1 2.04 1.2 1.72 9 10 11 12 13 14 15 16 17 18 19 20 1.3 1.75 1.4 1.74 1.5 3.46 1.6 4.26 1.7 2.62 1.8 2.13 21


