

Question: I need help coding this problem in R Notebooks. Project 3 distribution with = 4 . use a built - in function that directly draws
I need help coding this problem in R Notebooks.
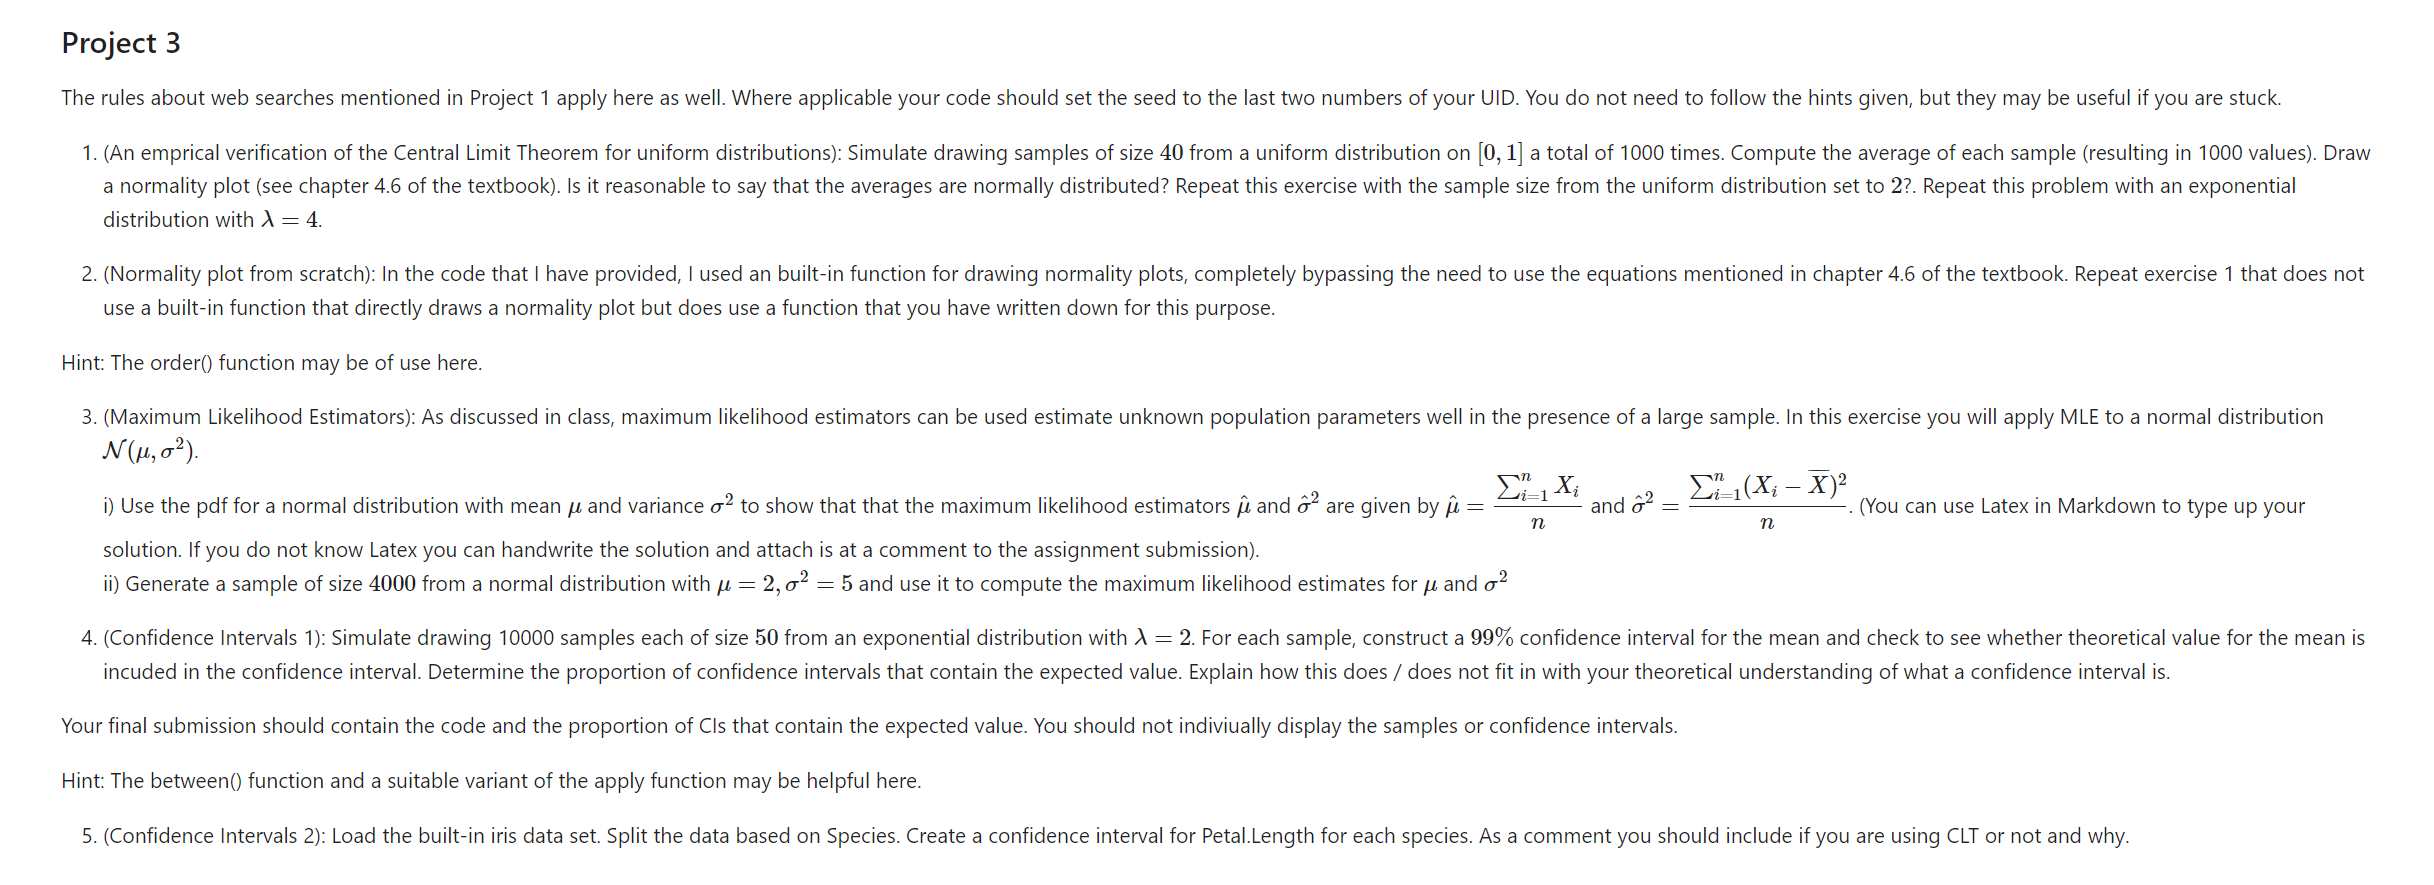
Project
distribution with
use a builtin function that directly draws a normality plot but does use a function that you have written down for this purpose.
Hint: The order function may be of use here.
solution. If you do not know Latex you can handwrite the solution and attach is at a comment to the assignment submission
ii Generate a sample of size from a normal distribution with and use it to compute the maximum likelihood estimates for and
Your final submission should contain the code and the proportion of Cls that contain the expected value. You should not indiviually display the samples or confidence intervals.
Hint: The between function and a suitable variant of the apply function may be helpful here.
Step by Step Solution
There are 3 Steps involved in it
1 Expert Approved Answer
Step: 1 Unlock

Question Has Been Solved by an Expert!
Get step-by-step solutions from verified subject matter experts
Step: 2 Unlock
Step: 3 Unlock