Question: I need help completing the actually simulation that will provide the list of the sample number and the list of NPV's. Can you explain how
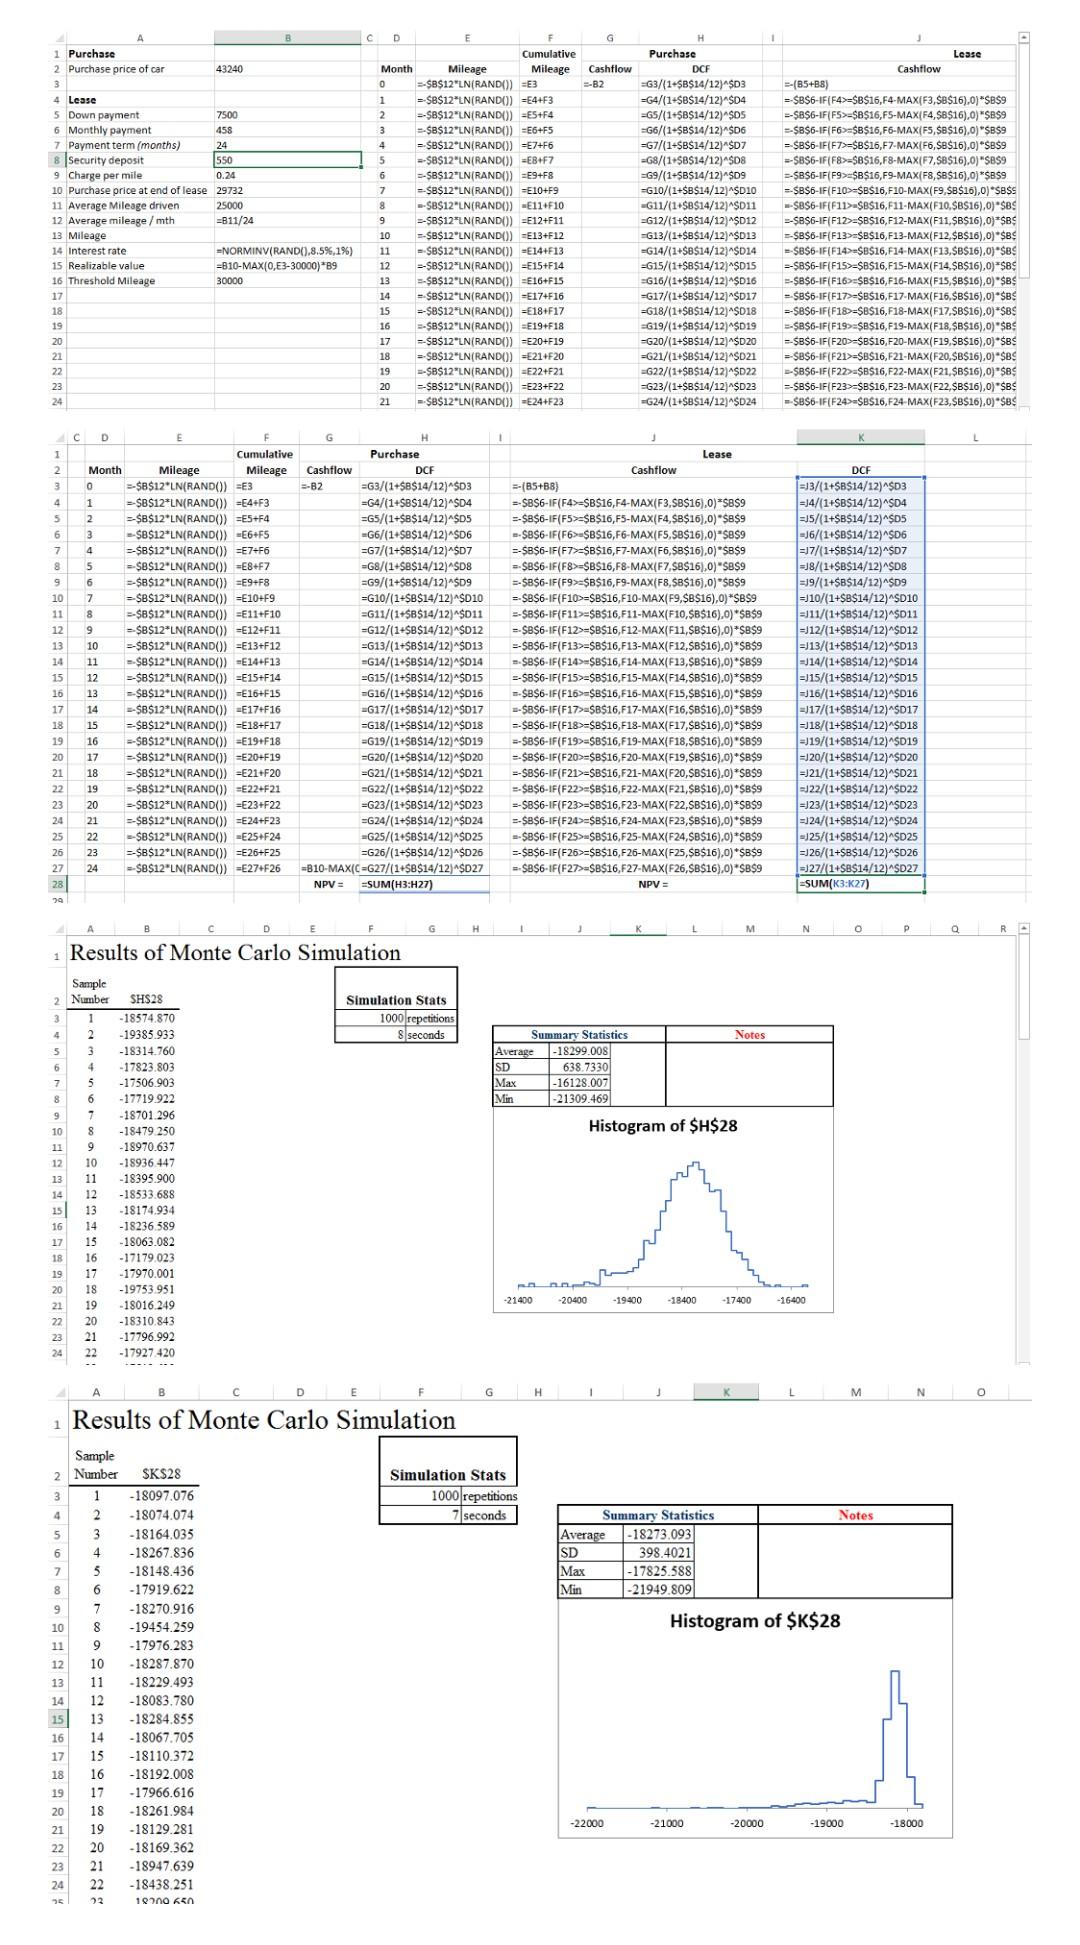
I need help completing the actually simulation that will provide the list of the sample number and the list of NPV's. Can you explain how to get the results of the Monte Carlo Simulation?
Purchase Cumulative Purchase Lease 2 Purchase price of car 43240 Month Mileage Mileage Cashflow DC Cashflow 3 $8$12"LN(RAND()) =E3 =-82 G3/(1+$8$14/12)^SD3 -(85+BB) 4 Lease =-SB$12"LN(RAND()) =E44F3 =G4/(1+$8$14/12)^SD4 =$B$6-IF(F4>=$8$16,F4-MAX(F3,SB$16),0)"SB$9 5 Down payment 7500 =-SB$12"LN(RAND()) =E5+F4 =G5/(1+SB$14/12)^SOS =$8$6-IF(FS>=$8$16,FS-MAX(F4,$8$16),0)"SB$9 6 Monthly payment 458 $8$12"LN(RAND()) =E6+F5 =G6/(1+$8$14/12)^$06 =$8$6-IF(F6)=$8$16,F6-MAX(F5,$8$16),0)"SB$9 Payment term (months) 24 .SBS12"LN(RAND()) =E7+F6 -G7/(1+SB$14/12)^SD7 -IF(F7>=$8$16,F7-MAX(F6,$8$16),0)"'S 8 Security deposit 550 -$8$12"LN(RAND()) =E8+F7 =G8/(1+$8$14/12)^SD8 =SB$6-IF(F8>=$8$16,F8-MAX(F7,$8$16),0) "SBS9 9 Charge per mile 0.24 -$8$12 LN(RAND()) =E9+F8 G9/(1+$8$14/12)^$09 > $8$16,F9-MAX(F8,$8$16),0)"SB$9 10 Purchase price at end of lease 29732 -SB$12"LN(RAND()) =E10+F9 G10/(1+$8$14/12)^SD10 >=$B$16, F10-MAX(F9,$8$16),0)"SBSS 11 Average Mileage driven 25000 -SBS12"LN(RAND()) -E11+F10 G11/(1+$8$14/12)^SD11 SBS6-IF(F11>=SB$16, F11-MAX(F10,$8$16),0)"SBS 12 Average mileage / mth =811/24 -SB$12"LN(RAND()) =E12+F11 G12/(1+$8$14/12)^SD12 $6-IF(F12>=$8$16,F12-MAX(F11,SB$16),0)*SBS 13 Mileage -SB$12"LN(RAND()) =E13+F12 G13/(1+$8$14/12)^SD13 -$8$6-IF(F13>=$8$16,F13-MAX(F12,$8$16),0)*SBS 14 Interest rate =NORMINV(RAND().8.5%,16) -SB$12"LN(RAND()) =E14+F13 G14/(1+$8$14/12)^$D14 =$8$6-IF(F14>=$8$16,F14-MAX(F13,$8$16),0)"SBS 15 Realizable value =B10-MAX(0,E3-30000) *89 --SB$12"LN(RAND()) =E15+F14 -G15/(1+$8$14/12)^SD15 B$6-IF(F15>=$8$16,F15-MAX(F14,SB$16),0)*SBS 16 Threshold Mileage 30000 =-$8$12"LN(RAND()) =E16+F15 G16/(1+$8$14/12)^SD16 16>=$8$16,F16-M $16),0)"SBS 17 14 = $8$12"LN(RAND()) =E17+F16 =G17/(1+$8$14/12)^$D17 -SB$6-IF(F17>=$8$16,F17-MAX(F16,$8$16),0)"SBS 18 15 #-58512"LN(RAND()) =E18+F17 -G18/(1+$8$14/12)^SD18 -SBS6-IF(F18>=$8$16,F18-M MAX(F17,$8$16),0)*SBS 19 16 -58$12"LN(RAND()) =E19+F18 G19/(1+$8$14/12)^SD19 20 17 - SBS12"LN (RAND()) =E20+F19 -G20/(1+$8$14/12)^$D20 = $8$6-IF(F20>=$8$16, F20-MAX(F19,$8$16),0)"SBS 21 18 -58512"LN (RAND()) =E21+F20 =G21/(1+$8$14/12)^SD21 -SB$6-IF(F21>=$8$16, F21-MAX(F20,SB$16),0)"'SBS 22 19 -$8$12"LN(RANDI)) -E22+F21 G22/(1+$B$14/12)^SD22 -$8$6-IF(F22>=$B$16, F22-MAX(F21,$8$16),0)"SBS 23 20 =-$8$12"LN(RAND()) =E23+F22 -G23/(1+$8$14/12)^$D23 =-$8$6-IF(F23>=$8$16,F23-MAX(F22,$B$16),0)"SBS 24 = $8$12"LN(RAND()) -E24+F23 -G24/(1+$8$14/12)^SD24 =$8$6-IF(F24>=SB$16,F24-MAX(F23,SBS16),0)"SBS 4 C D Cumulative Purchase Lease Month Mileage Mileage Cashflow DCF Cashflow DCF -$8$12"LN(RAND()) =E3 =-B2 =G3/(1+$8$14/12)^$D3 =(85+B8) =13/(1+$8$14/12)^$D3 SBS12*LN(RAND()) =E4+F3 =G4/(1+$8$14/12)^SD4 -SB$6-IF(F4>=$B$16,F4-MAX(F3,SB$16),0)"SB$9 =14/(1+SB$14/12)^SD4 -$B$12"LN(RAND()) =E5+F4 =G5/(1+$8$14/12)^SD5 -$8$6-IF(F5>=$8$16,F5-MAX(F4,$8$16),0)"SB$9 =15/(1+$8$14/12)^SD5 -SB$12"LN(RAND()) -E6+F5 -G6/(1+$8$14/12)^SD6 --$8$6-IF(F6>=$8$16,F6-MAX(F5,SB$16),0)"SB$9 -J6/(1+SB$14/12)^SD6 -$B$12"LN(RAND()) =E7+F6 =G7/(1+$8$14/12)^SD7 -$8$6-IF(F7>=$8$16,F7-MAX(F6,$8$16),0)"SB$9 =17/(1+$8$14/12)^SD7 $B$12"LN(RAND()) =E8+F7 G8/(1+SB$14/12)^SD8 =-$8$6-IF(F8>=$8$16,F8-MAX(F7,$8$16),0)"SB$9 =J8/(1+SB$14/12)^SDB -$8$12"LN(RAND()) =E9+F8 =G9/(1+$8$14/12)^SD9 -$8$6-IF(F9> =$8$16,F9-MAX(F8,$8$16),0)"$8$9 19/(1+$8$14/12)^SD9 SBS12*LN(RAND()) =E10+F9 =G10/(1+$8$14/12)^SD10 MAX(F9,SB$16),0)"SBS9 =J10/(1+$8$14/12)^SD10 -$8$12"LN(RAND()) =811+F10 =G11/(1+$8$14/12)^5011 IF(F11>= ,SB$16),0) *$8$9 =J11/(1+$8$14/12)^SD11 $8$12"LN(RAND()) =E12+F11 =G12/(1+$8$14/12)^SD12 -SB$6-IF(F12>= 2-MAX(F11,SB$16),0)*SB$9 =J12/(1+$B$14/12)^SD12 =-SB$12"LN(RAND()) =E13+F12 -G13/(1+$8$14/12)*SD13 =-$8$6-IF(F13>=$8$16,F13-MAX(F12,$8$16),0)*$8$9 =J13/(1+$8$14/12)^SD13 =$8$12"LN(RAND()) =E14+F13 -G14/(1+$8$14/12)^SD14 =.$8$6-IF(F14>=SB$16,F14-M LAX(F13,$8$16),0) "SB$9 J14/(1+$8$14/12)^$014 =-$B$12*LN(RAND()) =E15+F14 -G15/(1+$8$14/12)^5015 =-$8$6-IF(F15> -J15/(1+$8$14/12)^SD15 -$8$12"LN(RAND()) =E16+F15 -G16/(1+$8$14/12)^SD16 =-SB$6-IF(F16> $16),0)*$ -J16/(1+$8$14/12)^SD16 17 =$B$12"LN(RAND()) =E17+F16 -G17/(1+$8$14/12)~$017 --$8$6-IF(F17>= AX(F16,SB$16),0)*$859 -J17/(1+$8$14/12)^SD17 =$8$12"LN(RAND()) =E18+F17 =G18/(1+$8$14/12)^$D18 =-$8$6-IF(F18>=$8$16,F18-MAX(F17,SB$16),0)*$B$9 =J18/(1+$8$14/12)^$018 =-SB$12"LN(RAND()) =E19+F18 =G19/(1+$8$14/12)^SD19 =-$8$6-IF(F19>=SB$16,F19-M AX(F18,$8$16),0)"SBS9 =J19/(1+$8$14/12)^SD19 =$8$12*LN(RAND()) =E20+F19 -G20/(1+$8$14/12)^SD20 =-$8$6-IF(F20> AX(F19,$8$16),0)*$8$9 =120/(1+$8$14/12)^$D20 =-SB$12*LN(RAND()) =E21+F20 -G21/(1+$8$14/12)^SD21 LAX(F20,SB$16),0)*SBSS =J21/(1+SB$14/12)^SD21 =$8$12"LN(RAND()) =E22+F21 =G22/(1+$8$14/12)^SD22 =-$8$6-IF(F22>=$8$16,F22-MAX(F21,$8$16),0)*$B$9 =J22/(1+$8$14/12)^SD22 =$8$12*LN(RAND()) =E23+F22 =G23/(1+$8$14/12)^SD23 =-SB$6-IF(F23>=SB$16,F23-MAX(F22,SB$16),0)*SB$9 =123/(1+SB$14/12)^SD23 =$8$12"LN(RAND()) =E24+F23 =G24/(1+$8$14/12)^$D24 =-$8$6-IF(F24>=$8$16,F24-MAX(F23,$8$16),0) *$B$9 124/(1+$8$14/12)^SD24 =$8$12"LN(RAND()) =E25+F24 -G25/(1+58$14/12)^SD25 =-$8$6-IF(F25>=SB$16,F25-MAX(F24,SB$16),0)*SB$9 =J25/(1+SB$14/12)^SD25 =-$8$12"LN(RAND()) =E26+F25 =G26/(1+$8$14/12)^$026 =-$8$6-IF(F26>=$8$16,F26-MAX(F25,$8$16),0) *$B$9 J26/(1+SB$14/12)^SD26 =$8$12"LN(RAND()) =E27+F26 -810-MAX(C=G27/(1+$8$14/12)^SD27 =$8$6-IF(F27>=SB$16,F27-MAX(F26,SB$16),0)"SB$9 =127/(1+SB$14/12)^SD27 NPV = =SUM(H3:H27) NPV = =SUM(K3:K27) M 1 Results of Monte Carlo Simulation Sample 2 SH$28 Simulation Stats 18574.870 1000 repetitions -19385.933 8 seconds Summary Statistics Notes -18314.760 Average -18299.008 17823.803 SD 638.7330 -17506.903 Max -16128.007 8 -17719.922 Min -21309.469 9 -18701.296 10 -18479 250 Histogram of $H$28 -18970.637 12 10 -18936 447 13 -18395.900 14 -18533.688 15 -18174.934 16 -18236.589 17 -18063.082 18 -17179.023 19 -17970.001 20 -19753 951 -18016.249 -21 400 -20400 -19400 -18400 -17400 -16400 21 -18310.843 23 -17796.992 24 -17927.420 G H M O Results of Monte Carlo Simulation Sample 2 Number SK$28 Simulation Stats w 18097.076 1000 repetitions -18074.074 7 seconds Summary Statistics Notes -18164.035 Average -18273.093 18267.836 SD 398.4021 -18148.436 Max -17825.588 -17919.622 Min -21949.809 -18270.916 -19454.259 Histogram of $K$28 -17976.283 -18287.870 -18229.493 -18083.780 -18284.855 -18067.705 -18110.372 -18192.008 -17966.616 -18261.984 -18129.281 -22000 -21000 20000 -19000 -18000 -18169.362 -18947.639 -18438.251 18700 An