

Question: I need help completing the two spreadsheets. Almost all is done, just unsure where to go from here. Thank you! Exhibit 1 HORNIMAN HORTICULTURE Projected
I need help completing the two spreadsheets. Almost all is done, just unsure where to go from here. Thank you!
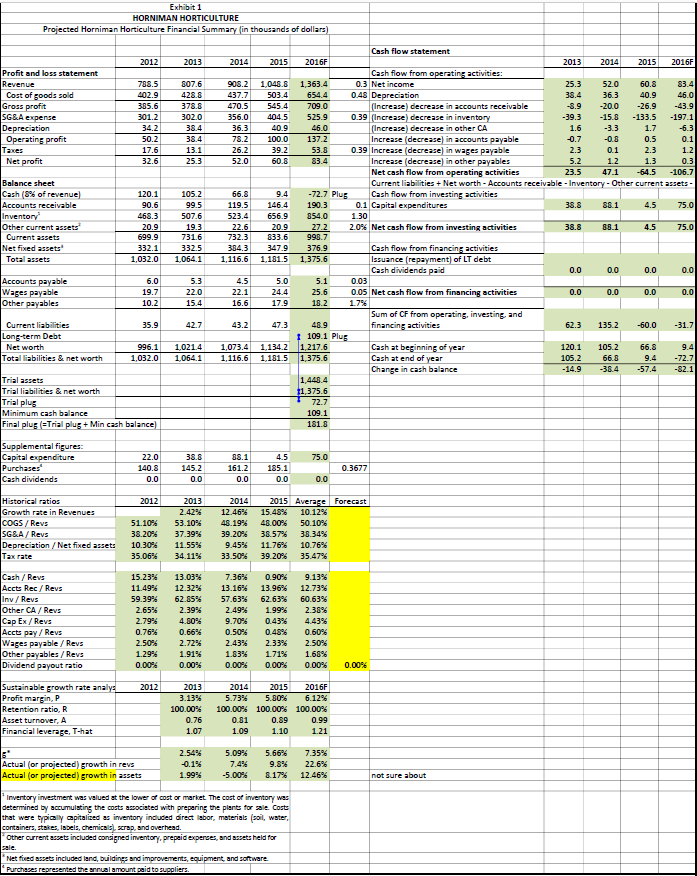
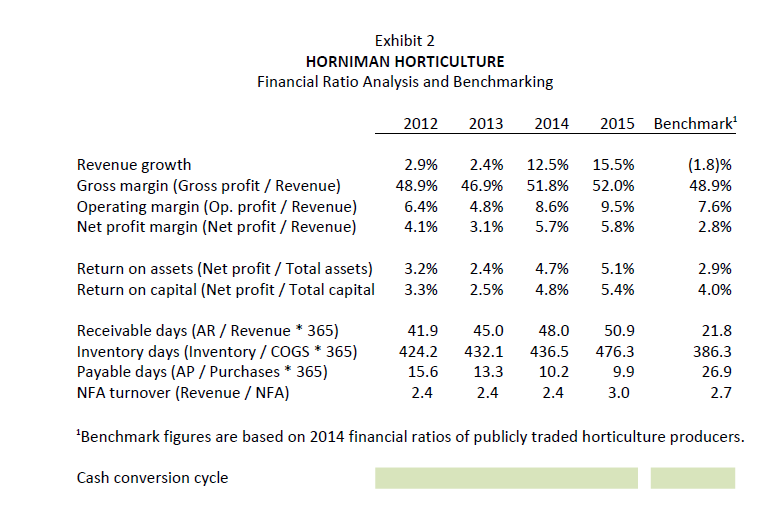
Exhibit 1 HORNIMAN HORTICULTURE Projected Horniman Horticulture Financial Summary in thousands of dollars) 2012 2013 2014 520 83.4 Profit and loss statement Revenue Cost of goods sold Gross profit SGS.A expense Depreciation Operating profit Taxes Net profit 788.5 402.9 385.6 301.2 34.2 50.2 17.6 32.6 807,6 428.8 378.8 302.0 38.4 38.4 13.1 25.3 908.2 437.7 470.5 356.0 36.3 78.2 26.2 52.0 -6.3 656.9 Balance sheet Cash (8% of revenue) Accounts receivable Inventory Other current assets Current assets Net fixed assets Total assets 120.1 90.6 468.3 20.9 699.9 332.1 1,032.0 105.2 99.5 507.6 19.3 731.6 332.5 1,0641 66.8 119.5 523.4 22.6 732.3 384.3 1,116.6 Cash flow statement 2015 2016F 2013 2014 2015 2016F Cash flow from operating activities: 1,048.8 1,363.4 0.3 Net income 25.3 60.8 503.4 654.4 0.48 Depreciation 38.4 36.3 40.9 46.0 545.4 709.0 (Increase) decrease in accounts receivable -8.9 -20.0 -26.9 -43.9 404.5 525.9 0.39 (Increase) decrease in inventory -39.3 -15.8 - 133.5 -197.1 40.9 46.0 (Increase) decrease in other CA 1.6 -3.3 1.7 100.0 137.2 Increase (decrease) in accounts payable -0.7 -0.8 0.5 0.1 39.2 53.8 0.39 Increase (decrease in wages payable 2.3 0.1 2.3 1.2 60.8 83.4 Increase (decrease) in other payables 5.2 1.2 1.3 0.3 Net cash flow from operating activities 23.5 47.1 -64.5 -106.7 Current liabilities + Net worth - Accounts receivable - Inventory - Other current assets - 9.4 -72.7 Plus Cash flow from investing activities 146.4 190.3 0.1 Capital expenditures 38.8 88.1 4.5 75.0 8540 1.30 20.9 27.2 2.0% Net cash flow from investing activities 38.8 8.3.1 4.5 75.0 833.6 996.7 347.9 376.9 Cash flow from financing activities 1,181.5 1.375.6 Issuance (repayment) of LT debt Cash dividends paid 0.0 0.0 0.0 0.0 5.0 5.1 0.03 24.4 25.6 0.05 Net cash flow from financing activities 0.0 0.0 0.0 0.0 17.9 18.2 1.7% Sum of CF from operating, investing, and 47.3 48.9 financing activities 62.3 135.2 -60.0 -31.7 109.1 Plus 1.134.2 1.217.6 Cash at beginning of year 120.1 105.2 66.8 1,181.5 1,375.6 Cash at end of year 105.2 66.8 -72.7 Change in cash balance -14.9 -38.4 -57.4 -82.1 1.440.4 11,375.6 72.7 109.1 181.8 Accounts payable Wages payable Other payables 6.0 19.7 10.2 5.3 22.0 15.4 4.5 22.1 16.6 35.9 42.7 43.2 Current liabilities Long-term Debt Net worth Total liabilities & net worth 996.1 1,032.0 1,021.4 1,0641 1,073.4 1.116.6 Trial assets Trial liabilities & net worth Trial plus Minimum cash balance Final plus (=Trial plug + Min cash balance) 75.0 Supplemental figures: Capital expenditure Purchases Cash dividends 22.0 140.8 0.0 38.8 145.2 0.0 38.1 161.2 0.0 4.5 185.1 0.0 0.3677 0.0 2012 Historical ratios Growth rate in Revenues COGS / Revs SG&A / Revs Depreciation / Net fixed assets Tax rate 51.10% 38.20% 10.30% 35.06% 2013 2.42% 53.10% 37.39% 11.55% 34.11% 2014 12.46% 48.19% 39.20% 9.45% 33.50% 2015 Average Forecast 15.48% 10.12% 48.00% 50.10% 38.57% 38.34% 11.76% 10.76% 39.20% 35.47% 9.13% Cash/Revs Accts Rec/Revs Iny/Revs Other CA / Revs Cap Ex/Revs Accts pay / Revs Wages payable / Revs Other payables / Revs Dividend payout ratio 15.23% 11.49% 59.39% 2.65% 2.79% 0.76% 2.50% 1.29% 0.00% 13.03% 12.32% 62.85% 2.39% 4.80% 0.66% 2.72% 1.91% 0.00% 7.36% 13.16% 57.63% 2.49% 9.70% 0.50% 2.43% 1.83% 0.00% 0.90% 13.96% 62.63% 1.9994 0.43% 0.48% 2.33% 1.71% 0.00% 12.73% 60.63% 2.38% 4.43% 0.60% 2.50% 1.68% 0.00% 0.00% 2012 Sustainable growth rate analys Profit margin, P Retention ratio, R Asset turnover, A Financial leverage. T-hat 2013 3.13% 100.00% 0.76 1.07 2014 2015 2016F 5.73% 5.30% 6.12% 100.00% 100.00% 100.00% 0.31 0.89 0.99 1.09 1.10 1.21 Actual (or projected) growth in revs Actual for projected) growth in assets 2.54% -0.1% 1.99% 5.09% 7.4% -5.00% 5.66% 9.8% 8.17% 7.35% 22.6% 12.46% not sure about Inventory investment was valued at the lower of cost or market. The cost of inventory was determined by accumulating the costs associated with preparing the plants for sale costs that were typically capitalized inventory included direct labor, materials (soil, water, containers, stales, labels, chemicals, rap, and overhead. Other current aszet: included consigned inventory, prepaid experces, and sszes held for * Net freed assets included land, buildings and improvements, equipment, and software Purchezes represented the annual amount paid to suppliers Exhibit 2 HORNIMAN HORTICULTURE Financial Ratio Analysis and Benchmarking 2012 2013 2014 2015 Benchmark Revenue growth Gross margin (Gross profit / Revenue) Operating margin (Op. profit / Revenue) Net profit margin (Net profit / Revenue) 2.9% 48.9% 6.4% 4.1% 2.4% 46.9% 4.8% 3.1% 12.5% 51.8% 8.6% 5.7% 15.5% 52.0% 9.5% 5.8% (1.8)% 48.9% 7.6% 2.8% Return on assets (Net profit / Total assets) Return on capital (Net profit / Total capital 3.2% 3.3% 2.4% 2.5% 4.7% 4.8% 5.1% 5.4% 2.9% 4.0% Receivable days (AR / Revenue * 365) Inventory days (Inventory / COGS * 365) Payable days (AP / Purchases * 365) NFA turnover (Revenue / NFA) 41.9 424.2 15.6 2.4 45.0 432.1 13.3 2.4 48.0 436.5 10.2 2.4 50.9 476.3 9.9 3.0 21.8 386.3 26.9 2.7 Benchmark figures are based on 2014 financial ratios of publicly traded horticulture producers. Cash conversion cycle Exhibit 1 HORNIMAN HORTICULTURE Projected Horniman Horticulture Financial Summary in thousands of dollars) 2012 2013 2014 520 83.4 Profit and loss statement Revenue Cost of goods sold Gross profit SGS.A expense Depreciation Operating profit Taxes Net profit 788.5 402.9 385.6 301.2 34.2 50.2 17.6 32.6 807,6 428.8 378.8 302.0 38.4 38.4 13.1 25.3 908.2 437.7 470.5 356.0 36.3 78.2 26.2 52.0 -6.3 656.9 Balance sheet Cash (8% of revenue) Accounts receivable Inventory Other current assets Current assets Net fixed assets Total assets 120.1 90.6 468.3 20.9 699.9 332.1 1,032.0 105.2 99.5 507.6 19.3 731.6 332.5 1,0641 66.8 119.5 523.4 22.6 732.3 384.3 1,116.6 Cash flow statement 2015 2016F 2013 2014 2015 2016F Cash flow from operating activities: 1,048.8 1,363.4 0.3 Net income 25.3 60.8 503.4 654.4 0.48 Depreciation 38.4 36.3 40.9 46.0 545.4 709.0 (Increase) decrease in accounts receivable -8.9 -20.0 -26.9 -43.9 404.5 525.9 0.39 (Increase) decrease in inventory -39.3 -15.8 - 133.5 -197.1 40.9 46.0 (Increase) decrease in other CA 1.6 -3.3 1.7 100.0 137.2 Increase (decrease) in accounts payable -0.7 -0.8 0.5 0.1 39.2 53.8 0.39 Increase (decrease in wages payable 2.3 0.1 2.3 1.2 60.8 83.4 Increase (decrease) in other payables 5.2 1.2 1.3 0.3 Net cash flow from operating activities 23.5 47.1 -64.5 -106.7 Current liabilities + Net worth - Accounts receivable - Inventory - Other current assets - 9.4 -72.7 Plus Cash flow from investing activities 146.4 190.3 0.1 Capital expenditures 38.8 88.1 4.5 75.0 8540 1.30 20.9 27.2 2.0% Net cash flow from investing activities 38.8 8.3.1 4.5 75.0 833.6 996.7 347.9 376.9 Cash flow from financing activities 1,181.5 1.375.6 Issuance (repayment) of LT debt Cash dividends paid 0.0 0.0 0.0 0.0 5.0 5.1 0.03 24.4 25.6 0.05 Net cash flow from financing activities 0.0 0.0 0.0 0.0 17.9 18.2 1.7% Sum of CF from operating, investing, and 47.3 48.9 financing activities 62.3 135.2 -60.0 -31.7 109.1 Plus 1.134.2 1.217.6 Cash at beginning of year 120.1 105.2 66.8 1,181.5 1,375.6 Cash at end of year 105.2 66.8 -72.7 Change in cash balance -14.9 -38.4 -57.4 -82.1 1.440.4 11,375.6 72.7 109.1 181.8 Accounts payable Wages payable Other payables 6.0 19.7 10.2 5.3 22.0 15.4 4.5 22.1 16.6 35.9 42.7 43.2 Current liabilities Long-term Debt Net worth Total liabilities & net worth 996.1 1,032.0 1,021.4 1,0641 1,073.4 1.116.6 Trial assets Trial liabilities & net worth Trial plus Minimum cash balance Final plus (=Trial plug + Min cash balance) 75.0 Supplemental figures: Capital expenditure Purchases Cash dividends 22.0 140.8 0.0 38.8 145.2 0.0 38.1 161.2 0.0 4.5 185.1 0.0 0.3677 0.0 2012 Historical ratios Growth rate in Revenues COGS / Revs SG&A / Revs Depreciation / Net fixed assets Tax rate 51.10% 38.20% 10.30% 35.06% 2013 2.42% 53.10% 37.39% 11.55% 34.11% 2014 12.46% 48.19% 39.20% 9.45% 33.50% 2015 Average Forecast 15.48% 10.12% 48.00% 50.10% 38.57% 38.34% 11.76% 10.76% 39.20% 35.47% 9.13% Cash/Revs Accts Rec/Revs Iny/Revs Other CA / Revs Cap Ex/Revs Accts pay / Revs Wages payable / Revs Other payables / Revs Dividend payout ratio 15.23% 11.49% 59.39% 2.65% 2.79% 0.76% 2.50% 1.29% 0.00% 13.03% 12.32% 62.85% 2.39% 4.80% 0.66% 2.72% 1.91% 0.00% 7.36% 13.16% 57.63% 2.49% 9.70% 0.50% 2.43% 1.83% 0.00% 0.90% 13.96% 62.63% 1.9994 0.43% 0.48% 2.33% 1.71% 0.00% 12.73% 60.63% 2.38% 4.43% 0.60% 2.50% 1.68% 0.00% 0.00% 2012 Sustainable growth rate analys Profit margin, P Retention ratio, R Asset turnover, A Financial leverage. T-hat 2013 3.13% 100.00% 0.76 1.07 2014 2015 2016F 5.73% 5.30% 6.12% 100.00% 100.00% 100.00% 0.31 0.89 0.99 1.09 1.10 1.21 Actual (or projected) growth in revs Actual for projected) growth in assets 2.54% -0.1% 1.99% 5.09% 7.4% -5.00% 5.66% 9.8% 8.17% 7.35% 22.6% 12.46% not sure about Inventory investment was valued at the lower of cost or market. The cost of inventory was determined by accumulating the costs associated with preparing the plants for sale costs that were typically capitalized inventory included direct labor, materials (soil, water, containers, stales, labels, chemicals, rap, and overhead. Other current aszet: included consigned inventory, prepaid experces, and sszes held for * Net freed assets included land, buildings and improvements, equipment, and software Purchezes represented the annual amount paid to suppliers Exhibit 2 HORNIMAN HORTICULTURE Financial Ratio Analysis and Benchmarking 2012 2013 2014 2015 Benchmark Revenue growth Gross margin (Gross profit / Revenue) Operating margin (Op. profit / Revenue) Net profit margin (Net profit / Revenue) 2.9% 48.9% 6.4% 4.1% 2.4% 46.9% 4.8% 3.1% 12.5% 51.8% 8.6% 5.7% 15.5% 52.0% 9.5% 5.8% (1.8)% 48.9% 7.6% 2.8% Return on assets (Net profit / Total assets) Return on capital (Net profit / Total capital 3.2% 3.3% 2.4% 2.5% 4.7% 4.8% 5.1% 5.4% 2.9% 4.0% Receivable days (AR / Revenue * 365) Inventory days (Inventory / COGS * 365) Payable days (AP / Purchases * 365) NFA turnover (Revenue / NFA) 41.9 424.2 15.6 2.4 45.0 432.1 13.3 2.4 48.0 436.5 10.2 2.4 50.9 476.3 9.9 3.0 21.8 386.3 26.9 2.7 Benchmark figures are based on 2014 financial ratios of publicly traded horticulture producers. Cash conversion cycle
Step by Step Solution
There are 3 Steps involved in it

Get step-by-step solutions from verified subject matter experts