

Question: I need help constructing this project I want to use elements from football or food two things I love. I am leaning towards food specifically
I need help constructing this project I want to use elements from football or food two things I love. I am leaning towards food specifically burger businesses. I am thinking about a new entrepreneurstarting a fast food burger restaurant and eventually a chain. I have started my project I just need help and guidance in making it relevant to a procedure from the course. I think the business or problem should deal with the time it takes either broiler versus the griddle for the burger to cook. Maybe price of the machines can come into factor and whenthe return of investment would happen for either process? I have attached examples that were provided for reference. I hope you can help out configuring a Chi-square or ANOVA or a Critical versus P-value hypothesis? The ProjectStart image is what I have started so far for this project.
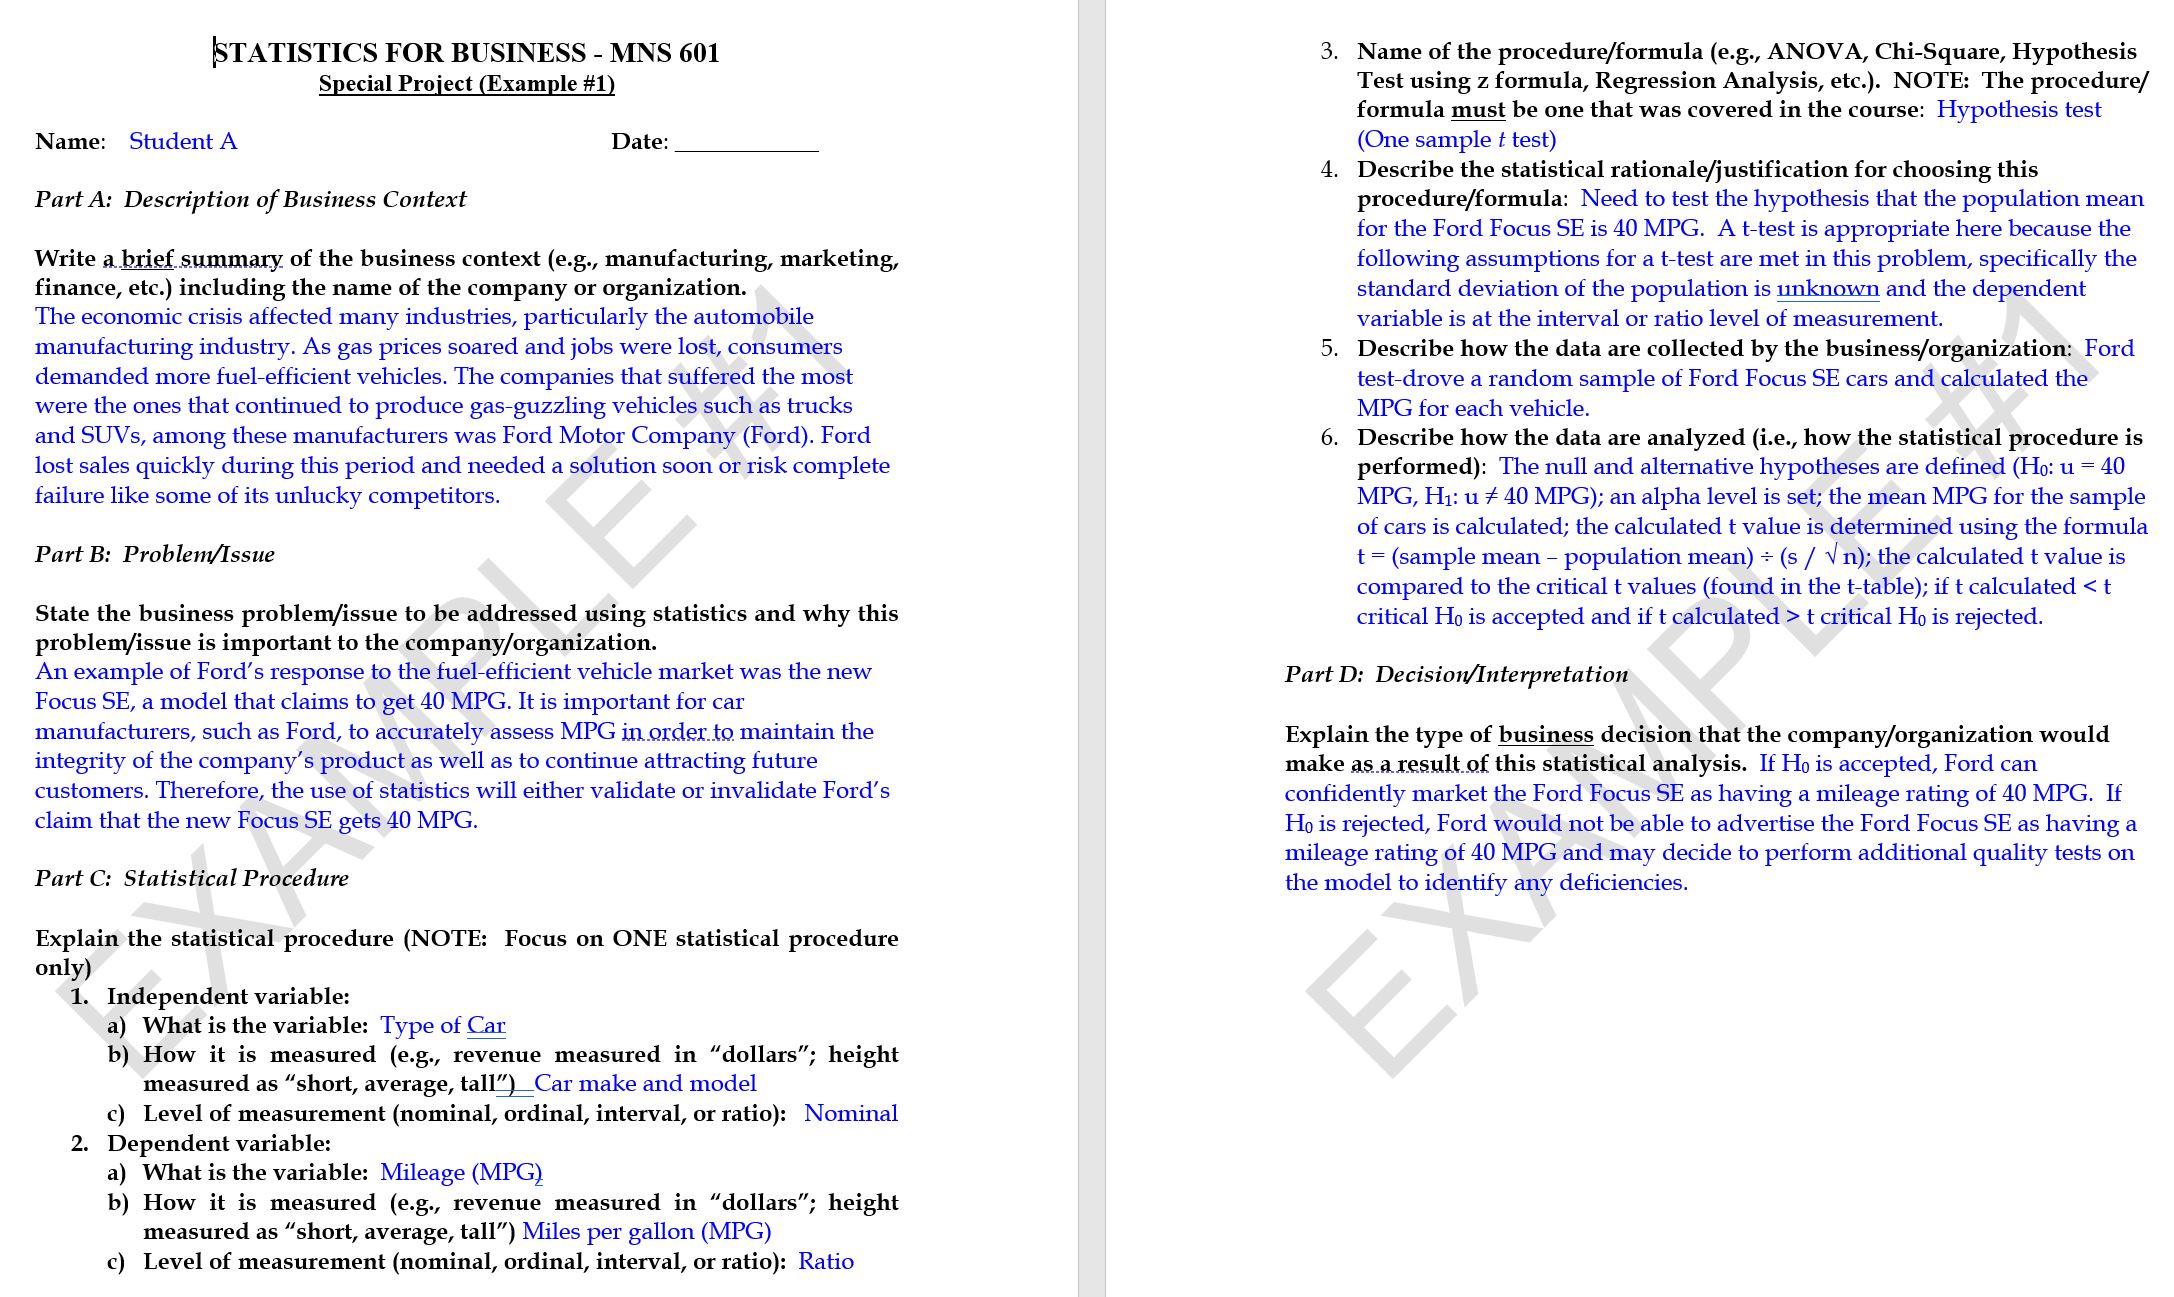
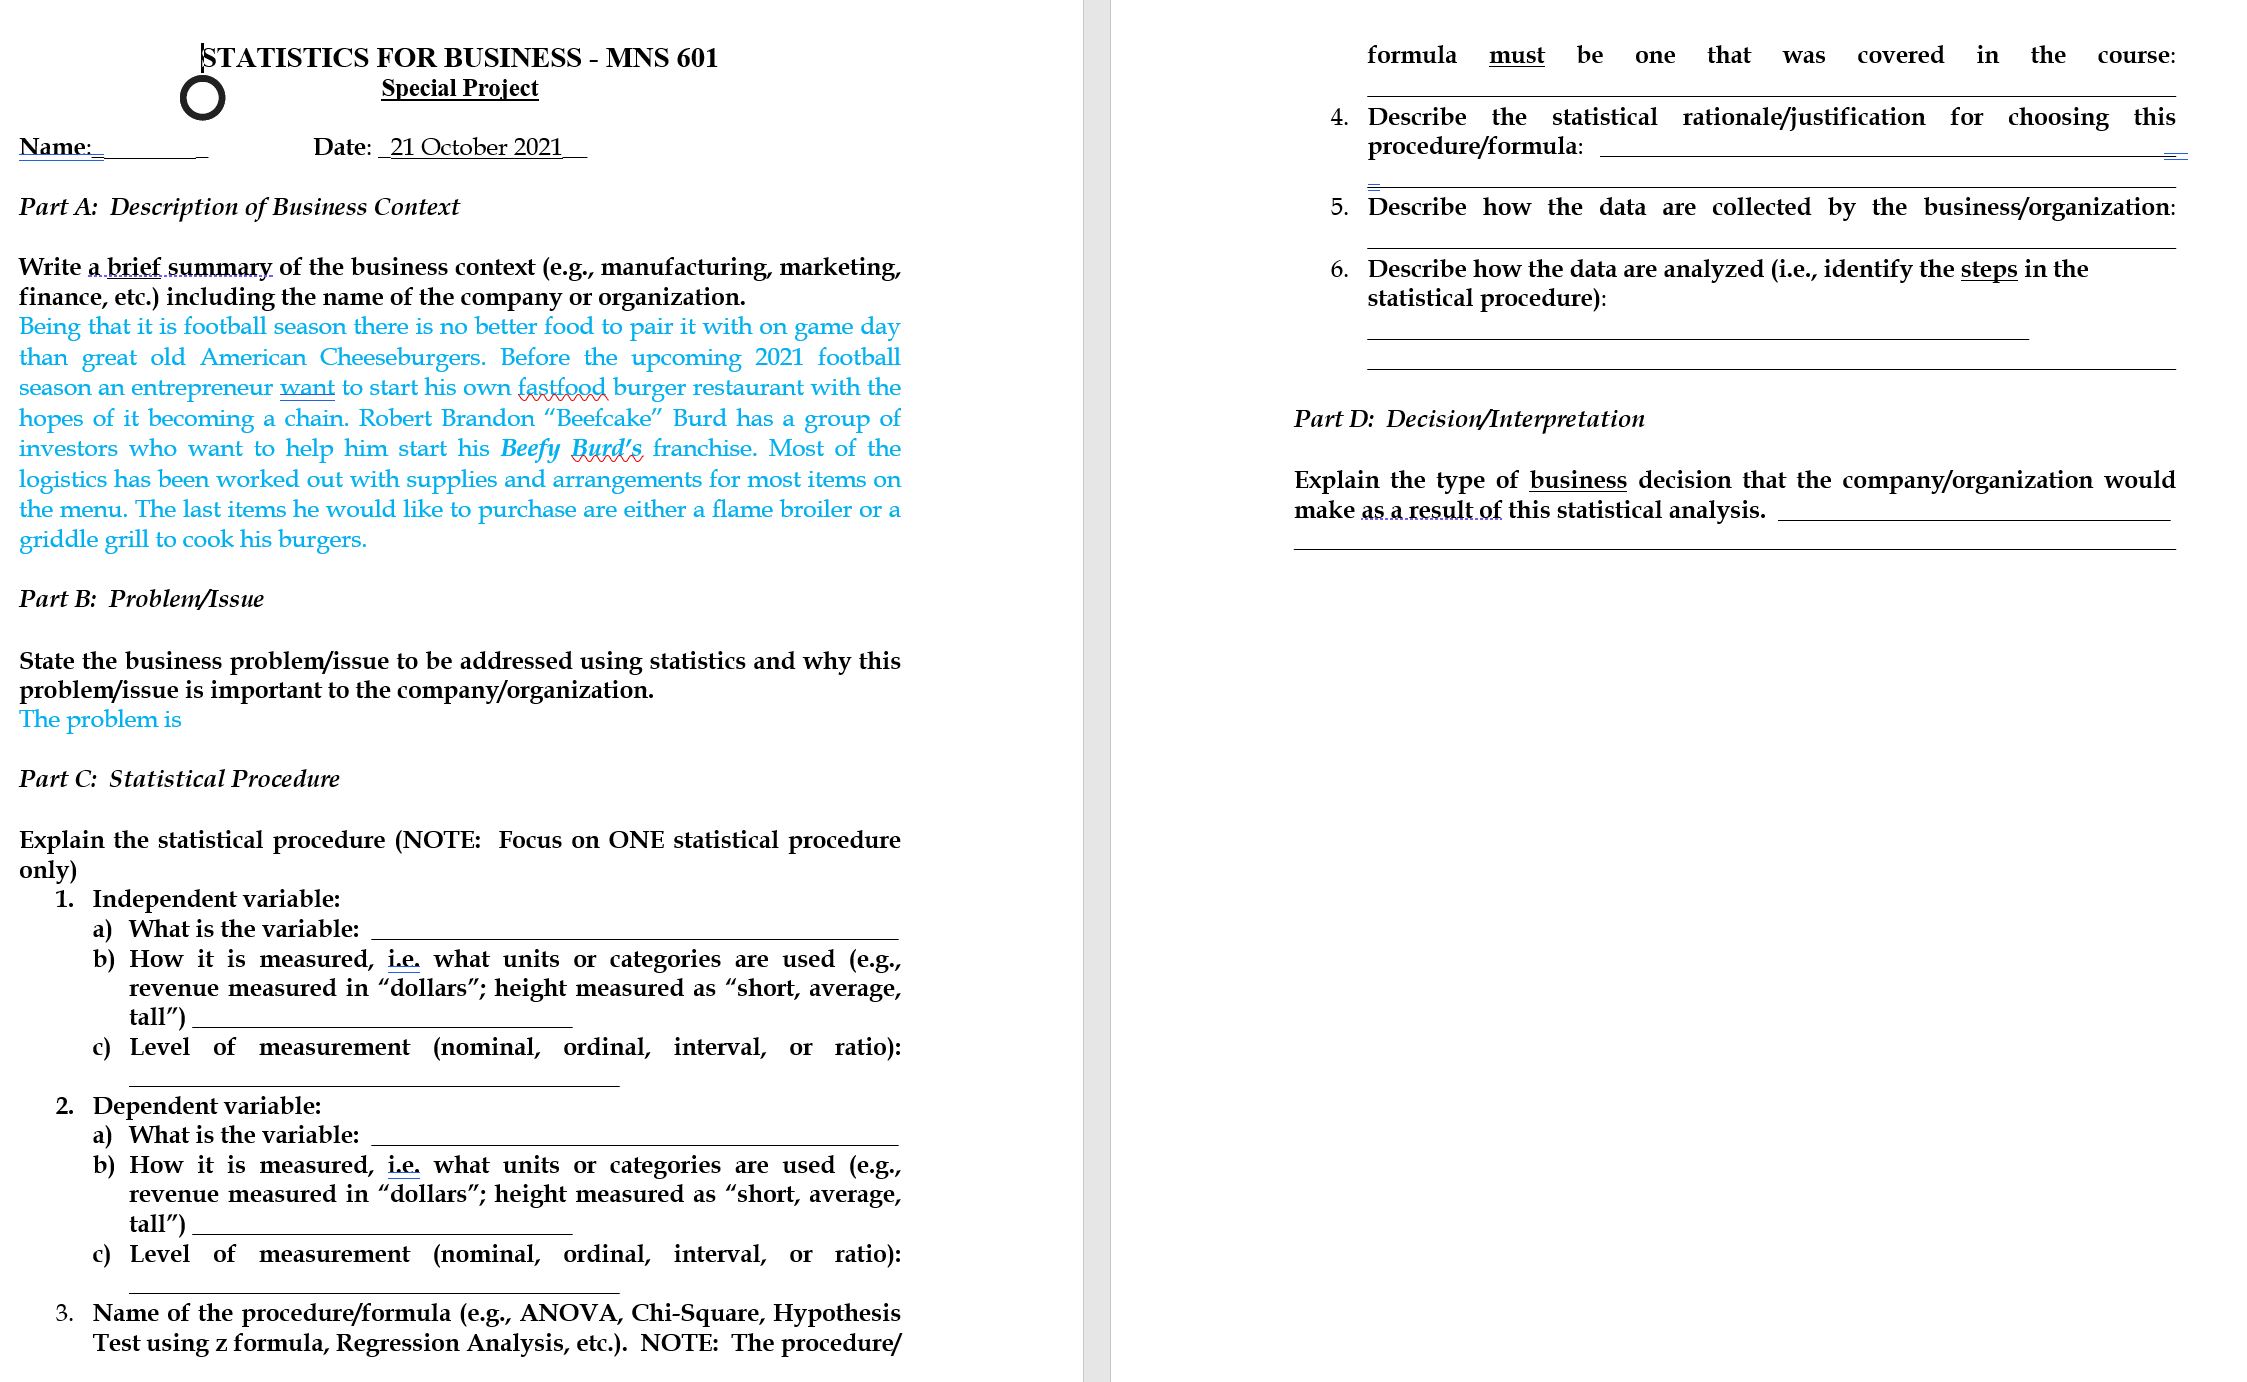
STATISTICS FOR BUSINESS - MNS 601 S ecial Pro'ect xunr le #1 Name: Student A Date: PurtA: Description of Business Context Write LMAHMM of the business context (e.g., manufacturing, marketing, finance, etc.) including the name of the company or organization. The economic crisis affected many industries, particularly the automobile manufacturing industry. As gas prices soared and jobs were lost, consumers demanded more fuelieicient vehicles. The companies that suffered the most were the ones that continued to produce gasiguzzling vehicles such as trucks and SUVs, among these manufacturers was Ford Motor Company (Ford). Ford lost sales quickly during this period and needed a solution soon or risk complete failure like some of its unlucky competitors. Part B: Problem/Issue State the business problem/issue to be addressed using statistics and why this problem/issue is important to the company/organization. An example of Ford's response to the fuelaefficient vehicle market was the new Focus SE, a model that claims to get 40 MPG. It is important for car manufacturers, such as Ford, to accurately assess NIPG ingrderto. maintain the integrity of the company's product as well as to continue attracting future customers. Therefore, the use of statistics will either validate or invalidate Ford's claim that the new Focus SE gets 40 lVH'G. Part C: Statistical Procedure Explain the statistical procedure (NOTE: Focus on ONE statistical procedure only) 1. Independent variable: a) What is the variable: Type of g b) How it is measured (e.g., revenue measured in "dollars\"; height measured as \"short, average, tall;Car make and model c) Level of measurement (nominal, ordinal, interval, or ratio): Nominal 2. Dependent variable: a) What is the variable: Mileage (MPG) b) How it is measured (e.g., revenue measured in \"dollars"; height measured as "short, average, tall") Nliles per gallon (NIPG) c) Level of measurement (nominal, ordinal, interval, or ratio): Ratio 3. Name of the procedure/formula (e.g., ANOVA, ChiSquare, Hypothesis Test using z formula, Regression Analysis, etc.). NOTE: The procedure] formula m be one that was covered in the course: Hypothesis test (One sample t test) 4. Describe the statistical rationale/justification for choosing this procedure/formula: Need to test the hypothesis that the population mean for the Ford Focus SE is 40 MPG. A titest is appropriate here because the following assumptions for a titest are met in this problem, specically the standard deviation of the population is unkmmm and the dependent variable is at the interval or ratio level of measurement. 5. Describe how the data are collected by the business/organization: Ford testidrove a random sample of Ford Focus SE cars and calculated the MPG for each vehicle. 6. Describe how the data are analyzed (i.e., how the statistical procedure is performed): The null and alternative hypotheses are defined (Ho: u : 40 lVIPG, H1: u at 40 MPG); an alpha level is set; the mean lVIPG for the sample of cars is calculated; the calculated tValue is determined using the formula t : (sample mean population mean) + (s / \\l n); the calculated t value is compared to the critical t values (found in the titable); if t calculated t critical H0 is rejected. Part D: Decision/Interpretu tion Explain the type of business decision that the company/organization would make asaresultnf this statistical analysis. If H0 is accepted, Ford can confidently market the Ford Focus SE as having a mileage rating of 40 MPG. If Hg is rejected, Ford would not be able to advertise the Ford Focus SE as having a mileage rating of 40 MPG and may decide to perform additional quality tests on the model to identify any deficiencies. STATISTICS FOR BUSINESS ms 601 0 Special Project Name; Date: 21 October 2021 Part A: Description of Business Context Write msnm of the business context (e.g., manufacturing marketing, finance, etc.) including the name of the company or organization. Being that it is football season there is no better food to pair it with on game day than great old American Cheeseburgers. Before the upcoming 2021 football season an entrepreneur want to start his om Wburger restaurant with the hopes of it becoming a chain. Robert Brandon \"Beefcake\" Burd has a group of investors who want to help him start his Beefy W franchise Most of the logistics has been worked out with supplies and arrangements for most items on the menu. The last items he would like to purchase are either a ame broiler or a griddle grill to cook his burgers. Part B: Problem/Issue State the business problem/issue to be addressed using statistics and why this problem/issue is important to the company/organization. The problem is Part C: Statistical Procedure Explain the statistical procedure (NOTE: Focus on ONE statistical procedure my) 1. Independentvariable: a) What is the variable: b) How it is measured, i.e. what units or categories are used (e.g., revenue measured in \"dollars\"; height measured as \"short, average, tall\") c) Level of measurement (nominal, ordinal, interval, or ratio): 2. Dependentvariable: a) What is the variable: b) How it is measured, ii what units or categories are used (e.g., revenue measured in \"dollars\"; height measured as \"short, average, tall\") c) Level of measurement (nominal, ordinal, interval, or ratio): 3. Name of the procedure/formula (e.g., ANOVA, Chi-Square, Hypothesis Test using 1 formula, Regression Analysis, etc.). NOTE: The procedure] formula must be one that was covered in the course: 4. Describe the statistical rationale/justification for choosing this procedure/formula: 5. Eescribe how the data are collected by the business/organization: 6. Describe how the data are analyzed (i.e., identify the steps in the statistical procedure): Part D: Decision/Interpretation Explain the type of business decision that the company/organization would make asaresultof. this statistical analysis
Step by Step Solution
There are 3 Steps involved in it

Get step-by-step solutions from verified subject matter experts