

Question: I need help correcting this problem: - X Standard Normal Distribution Table (Page 2) Standard Normal Distribution Table (Page 1) Areas under the Normal Curve
I need help correcting this problem:
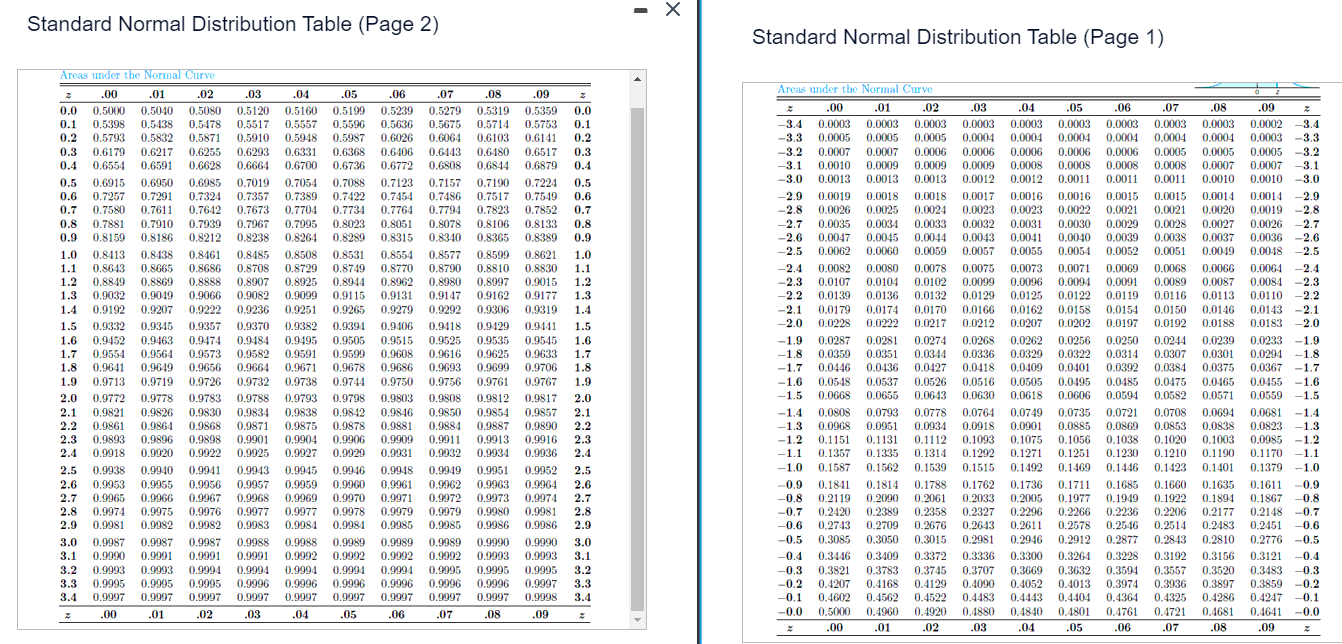
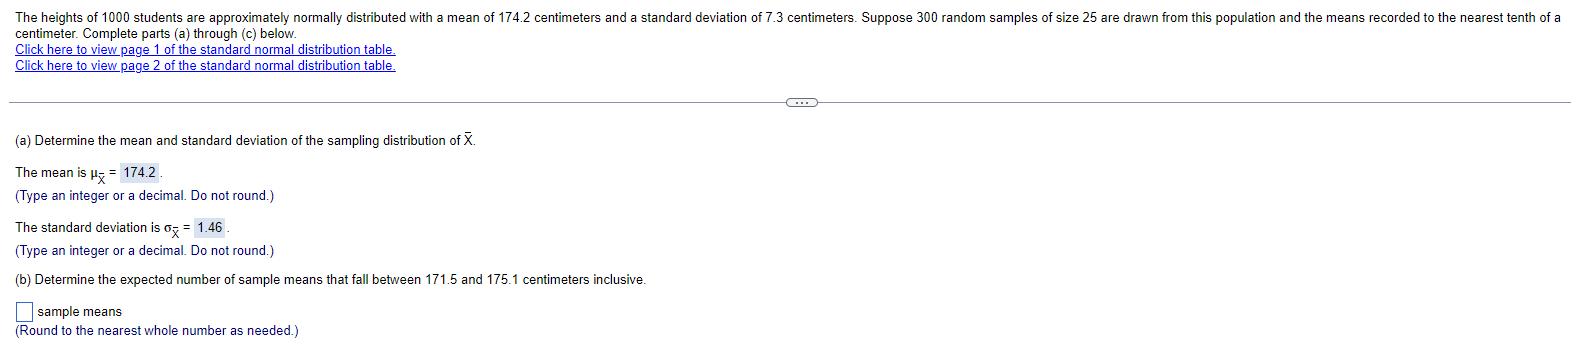
- X Standard Normal Distribution Table (Page 2) Standard Normal Distribution Table (Page 1) Areas under the Normal Curve Areas under the Normal Curve 00 .01 02 03 .04 .05 .06 -07 .08 .09 z .00 01 02 .03 .04 .05 .06 .07 .08 09 Z 0.0 0.5000 0.5040 0.5080 0.5120 0.5160 0.5199 0.5239 0.5279 0.5319 0.5359 0.0 -3.4 0.0003 0.0003 0.0003 0.0003 0.0003 0.0003 0.0003 0.0003 0.0003 0.0002 -3.4 0.1 0.5398 0.5438 0.5478 0.5517 0.5557 0.5596 0.5636 0.5675 0,5714 0.5753 0.1 0.6026 0.6064 0.6103 0.6141 0.2 -3,3 0.0005 0.0005 0.0105 0.0004 0.0004 0.0004 0.0004 0.0004 0.0004 0.0003 -3.3 0.2 0.5793 0.5832 0.5871 0.5910 0.5948 0.5987 0.0005 0.0005 0.0005 -3.2 0.3 0.6179 0.6217 0.6255 0.6293 0.6331 0.6368 0.6406 0.6443 0.6480 0.6517 0.3 -3.2 0.0007 0.0007 0.0006 0.0006 0.0006 0.0006 0.0006 -3.1 0.0010 0.0009 0.0009 0.0009 0.0008 0.0008 0.0008 0.0008 0.0007 0.0007 -3.1 0.4 0.6554 0.6591 0.6628 0.6664 0.6700 0.6736 0.6772 0.6808 0.6844 0.6879 0.4 -3.0 0.0013 0.0013 0.0013 0.0012 0.0012 0.0011 0.0011 0.0011 0.0010 0.0010 -3.0 0.5 0.6915 0.6950 0.6985 0.7019 0.7054 0.7088 0.7123 0.7157 0.7190 0.7224 0.5 0.0016 0.0015 0.0015 0.0014 0.0014 -2.9 0.6 0.7257 0.7291 0.7324 0.7357 0.7389 0.7422 0.7454 0.7486 0.7517 0.7549 0.6 -2.9 0.0019 0.0018 0.0018 0.0017 0.0016 0.0026 0.0025 0.0024 0.0023 0.0023 0.0022 0.0021 0.0021 0.0020 0.0019 -2.8 0.7 0.7580 0.7611 0.7642 0.7673 0.7704 0.7734 0.7764 0.7794 0.7823 0.7852 0.7 -2.8 0.0028 0.0027 0.0026 -2.7 0.7881 0.7910 0.7939 0.7967 0.7995 0.8023 0.8051 0.8078 0.8106 0.8133 0.8 -2.7 0.0035 0.0034 0.0033 0.0032 0.0031 0.0030 0.0029 0.8 0.0041 0.0040 0.0039 0.0038 0.0037 0.0036 -2.6 0.9 0.8159 0.8186 0.8212 0.8238 0.8264 0.8289 0.8315 0.8340 0.8365 0.8389 0.9 -2.6 0.0047 0.0045 0.0044 0.0043 -2.5 0.0062 0.0060 0.0059 0.0057 0.0055 0.0054 0.0052 0.0051 0.0049 0.0048 -2.5 1.0 0.8413 0.8438 0.8461 0.8485 0.8508 0.8531 0.8554 0.8577 0.8599 0.8621 1.0 0.8830 1.1 -2.4 0.0082 0.0080 0.0078 0.0075 0.0073 0.0071 0.0069 0.0068 0.0066 0.0064 -2.4 1.1 0.8643 0.8665 0.8686 0.8708 0.8729 0.8749 0.8770 0.8790 0.8810 0.8888 0.8907 0.8925 0.8944 0.8962 0.8980 0.8997 0.9015 1.2 -2.3 0.0107 0.0104 0.0102 0.0099 0.0096 0.0094 0.0091 0.0089 0.0087 0.0084 -2.3 1.2 0.8849 0.8869 -2.2 0.0139 0.0136 0.0132 0.0129 0.0125 0.0122 0.0119 0.0116 0.0113 0.0110 -2.2 1.3 0.9032 0.9049 0.9066 0.9082 0.9099 0.9115 0.9131 0.9147 0.9162 0.9177 1.3 0.0179 0.0174 0.0170 0.0166 0.0162 0.0158 0.0154 0.0150 0.0146 0.0143 -2.1 1.4 0.9192 0.9207 0.9222 0.9236 0.9251 0.9265 0.9279 0.9292 0.9306 0.9319 1.4 -2.1 0.9418 0.9429 0.9441 1.5 -2.0 0.0228 0.0222 0.0217 0.0212 0.0207 0.0202 0.0197 0.0192 0.0188 0.0183 -2.0 1.5 0.9332 0.9345 0.9357 0.9370 0.9382 0.9394 0.9406 0.9515 0.9525 0.9535 0.9545 1.6 -1.9 0.0287 0.0281 0.0274 0.0268 0.0262 0.0256 0.0250 0.0244 0.0239 0.0233 -1.9 1.6 0.9452 0.9463 0.9474 0.9484 0.9495 0.9505 -1.8 0.0359 0.0351 0.0344 0.0336 0.0329 0.0322 0.0314 0.0307 0.0301 0.0294 -1.8 1.7 0.9554 0.9564 0.9573 0.9582 0.9591 0.9599 0.9608 0.9616 0.9625 0.9633 1.7 -1,7 0.0446 0.0436 0.0427 0.0418 0.0409 0.0401 0.0392 0.0384 0.0375 0.0367 -1.7 1.8 0.9641 0,9649 0.9656 0.9664 0,9671 0,9678 0.9686 0.9693 0.9699 0.9706 1.8 0.0548 0.0537 0.0526 0.0516 0.0505 0.0495 0.0485 0.0475 0.0465 0.0455 -1.6 1.9 0.9713 0.9719 0.9726 0.9732 0.9738 0.9744 0.9750 0.9756 0.9761 0.9767 1.9 -1.6 -1,5 0.0668 0.0655 0.0643 0.0630 0.0618 0.0606 0.0594 0.0582 0.0571 0.0559 -1,5 2.0 0.9772 0.9778 0.9783 0.9788 0.9793 0.9798 0.9803 0.9808 0,9812 0.9817 2.0 0,9830 0.9834 0.9838 0,9842 0,9846 0.9850 0.9854 0.9857 2.1 -1.4 0.0808 0.0793 0.0778 0.0764 0.0749 0.0735 0.0721 0.0708 0.0694 0.0681 -1,4 2.1 0.9821 0,9826 -1.3 0.0968 0.0951 0.0934 0.0918 0.0901 0.0885 0.0869 0.0853 0.0838 0.0823 -1.3 2.2 0.9861 0.9864 0.9868 0.9871 0.9875 0.9878 0.9881 0.9884 0.9887 0.9890 2.2 0.1151 0.1131 0.1112 0.1093 0.1075 0.1056 0.1038 0.1020 0.1003 0.0985 -1.2 2.3 0.9893 0,9896 0.9898 0.9901 0.9904 0,9906 0.9909 0.9911 0.9913 0.9916 2.3 -1.2 0.1314 0.1292 0.1271 0.1251 0.1230 0.1210 0.1190 0.1170 -1.1 2.4 0.9918 0.9920 0.9922 0.9925 0.9927 0.9929 0.9931 0.9932 0.9934 0.9936 2.4 -1.1 0.1357 0.1335 -1.0 0.1587 0.1562 0.1539 0.1515 0.1492 0.1469 0.1446 0.1423 0.1401 0.1379 -1.0 2.5 0.9938 0.9940 0.9941 0.9943 0.9945 0.9946 0.9948 0.9949 0.9951 0.9952 2.5 0.1711 0.1685 0.1660 0.1635 0.1611 -0.9 2.6 0.9953 0.9955 0.9956 0.9957 0.9959 0.9960 0.9961 0.9962 0.9963 0.9964 2.6 -0.9 0.1841 0.1814 0.1788 0.1762 0.1736 -0.8 0.2119 0.2090 0.2061 0.2033 0.2005 0.1977 0.1949 0.1922 0.1894 0.1867 -0.8 2.7 0.9965 0.9966 0.9967 0.9968 0.9969 0.9970 0.9971 0.9972 0.9973 0.9974 2.7 0.2206 0.2177 0.2148 -0.7 2.8 0.9974 0.9975 0.9976 0.9977 0.9977 0.9978 0.9979 0.9979 0.9980 0.9981 2.8 -0.7 0.2420 0.2389 0.2358 0.2327 0.2296 0.2266 0.2236 0.2578 0.2546 0.2514 0.2483 0.2451 -0.6 2.9 0.9981 0.9982 0.9982 0.9983 0.9984 0.9984 0.9985 0.9985 0.9986 0.9986 2.9 -0.6 0.2743 0.2709 0.2676 0.2643 0.2611 -0.5 0.3085 0.3050 0.3015 0.2981 0.2946 0.2912 0.2877 0.2843 0.2810 0.2776 -0.5 3.0 0.9987 0.9987 0.9987 0.9988 0.9988 0.9989 0.9989 0.9089 0.9990 0.9990 3.0 0.3336 0.3300 0.3264 0.3228 0.3192 0.3156 0.3121 -0.4 3.1 0.9990 0.9991 0.9991 0.9991 0.9992 0.9992 0.9992 0.9092 0.9993 0.9993 3.1 -0.4 0.3446 0.3409 0.3372 -0.3 0.3821 0.3783 0.3745 0.3707 0.3669 0.3632 0.3594 0.3557 0.3520 0.3483 -0.3 3.2 0.9993 0.9993 0.9994 0.9994 0.9994 0.9994 0.9994 0.9995 0.9995 0.9995 3.2 0.4013 0.3974 0.3936 0.3897 0.3859 -0.2 3.3 0.9995 0.9995 0.9995 0.9996 0.9996 0.9996 0.9996 0.9996 0.9996 0.9997 3.3 -0.2 0.4207 0.4168 0.4129 0.4090 0.4052 0.9997 0.9997 0.9997 0.9997 0.9997 0.9997 0.9998 3.4 -0.1 0.4602 0.4562 0.4522 0.4483 0.4443 0.4404 0.4364 0.4325 0.4286 0.4247 -0.1 3.4 0.9997 0.9997 0.9997 .09 -0.0 0.5000 0.4960 0.4920 0.4880 0.4840 0.4801 0.4761 0.4721 0.4681 0.4641 -0.0 .00 .01 02 03 04 .05 .06 07 08 Z .00 .01 02 .03 04 05 06 07 .08 09The heights of 1000 students are approximately normally distributed with a mean of 174.2 centimeters and a standard deviation of 7.3 centimeters. Suppose 300 random samples of size 25 are drawn from this population and the means recorded to the nearest tenth of a centimeter. Complete parts (a) through (c) below. Click here to view page 1 of the standard normal distribution table. Click hers to view page 2 of the standard normal distribution table (a) Determine the mean and standard deviation of the sampling distribution of X. The mean is ug = 1742 . (Type an integer or a decimal. Do not round.) The standard deviation is o = 1.46 (Type an integer or a decimal. Do not round.) (b) Determine the expected number of sample means that fall between 1715 and 1751 centimetars inclusive sample means (Round to the nearest whole number as needed.)
Step by Step Solution
There are 3 Steps involved in it

Get step-by-step solutions from verified subject matter experts