

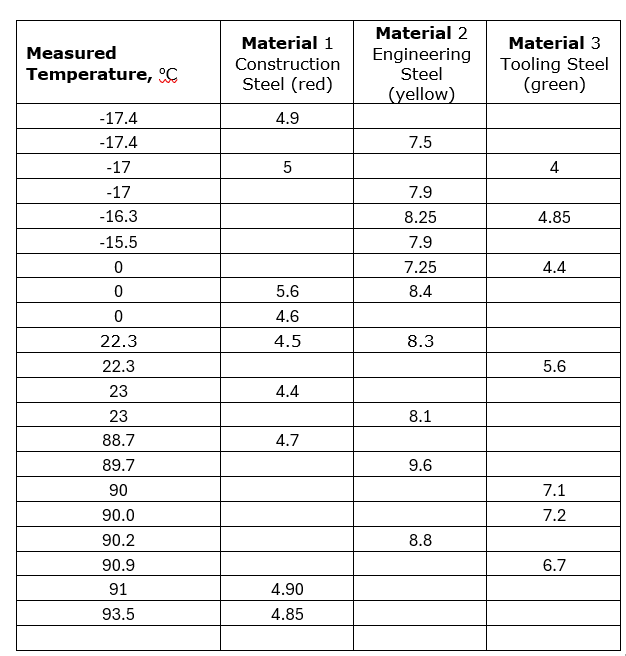
Question: I need help creating an impact energy graph from this data, the values shown are in J absorbed . I tried several times but cannot
I need help creating an impact energy graph from this data, the values shown are in J absorbed I tried several times but cannot get anything that resembles a Charpy Impact notch graph. Thanks for the help.
Measured Temperature, @C
Material Construction Steel red
Material Engineering Steel yellow
Material Tooling Steel green
Step by Step Solution
There are 3 Steps involved in it
1 Expert Approved Answer
Step: 1 Unlock

Question Has Been Solved by an Expert!
Get step-by-step solutions from verified subject matter experts
Step: 2 Unlock
Step: 3 Unlock