

Question: I need help D Question 2 25 pts Create a pie chart for the following California Covid- 19 Vaccine data from March 29,2021. Pfizer -
I need help
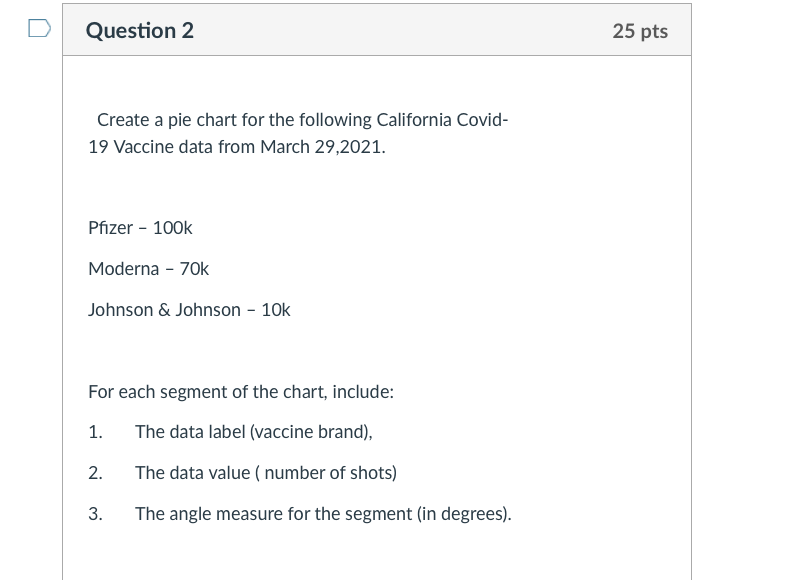
D Question 2 25 pts Create a pie chart for the following California Covid- 19 Vaccine data from March 29,2021. Pfizer - 100k Moderna - 70k Johnson & Johnson - 10k For each segment of the chart, include: 1. The data label (vaccine brand), 2. The data value ( number of shots) 3. The angle measure for the segment (in degrees)
Step by Step Solution
There are 3 Steps involved in it
1 Expert Approved Answer
Step: 1 Unlock

Question Has Been Solved by an Expert!
Get step-by-step solutions from verified subject matter experts
Step: 2 Unlock
Step: 3 Unlock