

Question: I need help emergency ctionary 2. The table below gives the height and shoe sizes of six randomly selected men. ead Aloud Height (in) 67
I need help emergency
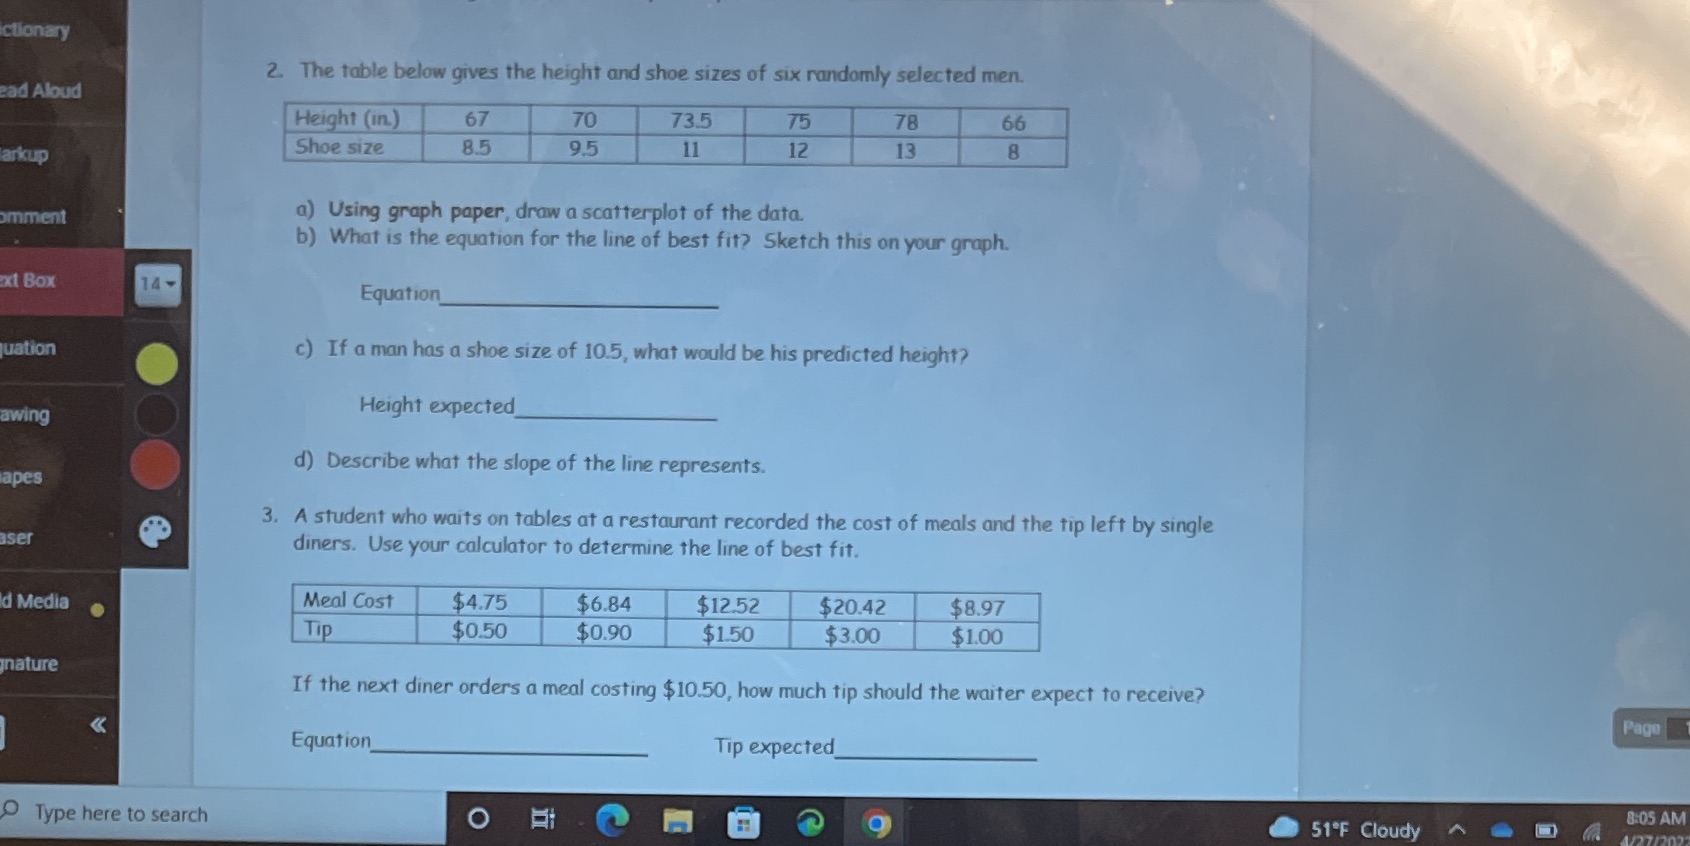
ctionary 2. The table below gives the height and shoe sizes of six randomly selected men. ead Aloud Height (in) 67 70 73.5 75 78 66 13 8 arkup Shoe size 8.5 9.5 11 12 omment a) Using graph paper, draw a scatterplot of the data. b) What is the equation for the line of best fit? Sketch this on your graph. exl Box 14- Equation juation c) If a man has a shoe size of 10.5, what would be his predicted height? Height expected awing d) Describe what the slope of the line represents. apes 3. A student who waits on tables at a restaurant recorded the cost of meals and the tip left by single user diners. Use your calculator to determine the line of best fit. d Media Meal Cost $4.75 $6.84 $12.52 $20.42 $8.97 Tip $0.50 $0.90 $1.50 $3.00 $1.00 nature If the next diner orders a meal costing $10.50, how much tip should the waiter expect to receive?
Step by Step Solution
There are 3 Steps involved in it

Get step-by-step solutions from verified subject matter experts