

Question: I need help explaining how do I think the sample from my homework data is representative of a.) University Students and b.) Visitors of the
I need help explaining how do I think the sample from my homework data is representative of a.) University Students and b.) Visitors of the facility?
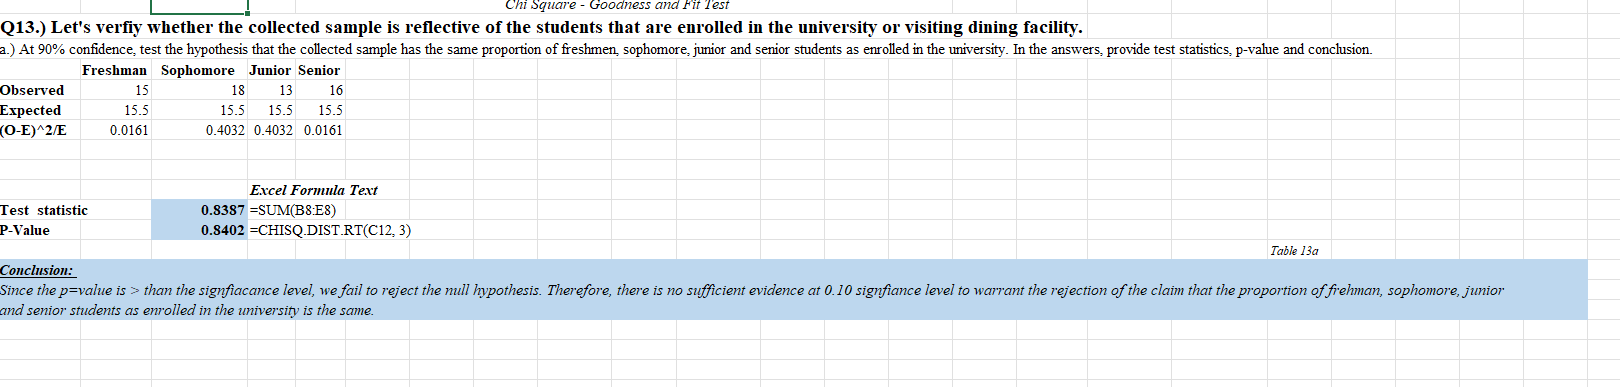
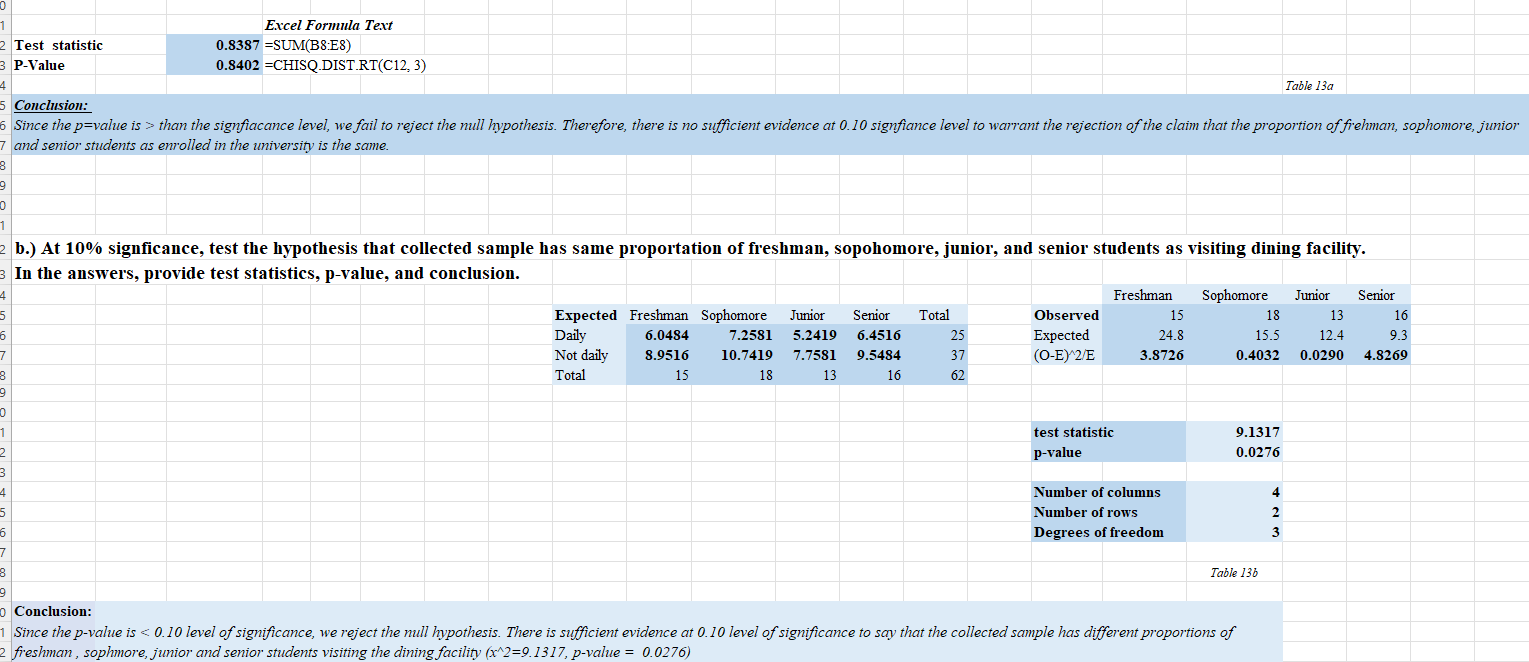
Chi Square - Goodness and Fit Test Q13.) Let's verfiy whether the collected sample is reflective of the students that are enrolled in the university or visiting dining facility. .) At 90% confidence, test the hypothesis that the collected sample has the same proportion of freshmen, sophomore, junior and senior students as enrolled in the university. In the answers, provide test statistics, p-value and conclusion. Freshman Sophomore Junior Senior Observed 15 18 13 16 Expected 15.5 15.5 15.5 15.5 O-E)^2/E 0.0161 0.4032 0.4032 0.0161 Excel Formula Text Test statistic 0.8387 =SUM(B8:E8) P-Value 0.8402 =CHISQ.DIST.RT(C12, 3) Table 13a Conclusion: Since the p=value is > than the signfiacance level, we fail to reject the null hypothesis. Therefore, there is no sufficient evidence at 0. 10 signfiance level to warrant the rejection of the claim that the proportion of frehman, sophomore, junior and senior students as enrolled in the university is the same.Excel Formula Text Test statistic 0.8387 =SUM(B8:ES) P-Value 0.8402 =CHISQ.DIST.RT(C12, 3) Table 13a Conclusion: Since the p=value is > than the signfiacance level, we fail to reject the null hypothesis. Therefore, there is no sufficient evidence at 0.10 signfiance level to warrant the rejection of the claim that the proportion of frehman, sophomore, junior and senior students as enrolled in the university is the same. b.) At 10% signficance, test the hypothesis that collected sample has same proportation of freshman, sopohomore, junior, and senior students as visiting dining facility. In the answers, provide test statistics, p-value, and conclusion. Freshman Sophomore Junior Senior Expected Freshman Sophomore Junior Senior Total Observed 15 18 13 16 Daily 6.0484 7.2581 5.2419 6.4516 25 Expected 24.8 15.5 12.4 9.3 Not daily 8.9516 10.7419 7.7581 9.5484 37 (O-E) 2/E 3.8726 0.4032 0.0290 4.8269 Total 15 18 13 16 62 test statistic 9.1317 p-value 0.0276 Number of columns Number of rows WNA Degrees of freedom Table 13b Conclusion: Since the p-value is
Step by Step Solution
There are 3 Steps involved in it

Get step-by-step solutions from verified subject matter experts