

Question: I need help, explaining how to even start this question and how to do it on excel my professor isn't that great and doesn't explain
I need help, explaining how to even start this question and how to do it on excel my professor isn't that great and doesn't explain very well. And I I am at a basic level with execl and she wants us to use a regression tool from the data analyst and I don't know what that is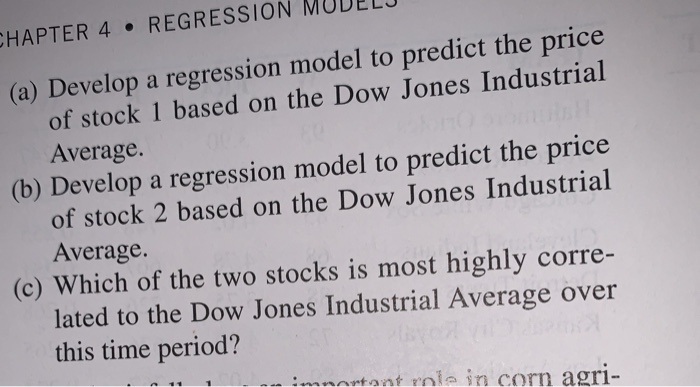
and how you get calcutions..
I promise you if you had me understand this question I will give you a thumbs up
and how to format .. this is so sad... im sorry 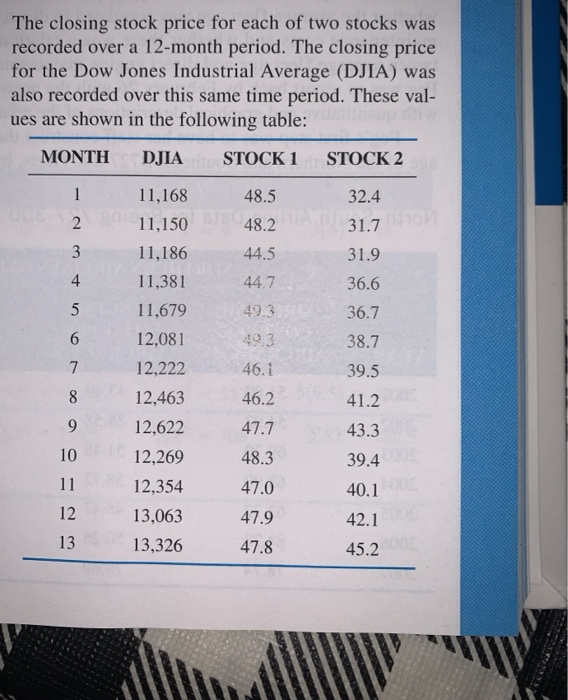
I don't understand
this class stresses me out
The closing stock price for each of two stocks was recorded over a 12-month period. The closing price for the Dow Jones Industrial Average (DJIA) was also recorded over this same time period. These val- ues are shown in the following table: MONTH DJIA STOCK 1 STOCK 2 1 48.5 48.2 2 32.4 31.7 31.9 3 44.5 4 44.7 36.6 5 49.3 36.7 11,168 11,150 11,186 11,381 11,679 12,081 12,222 12,463 12,622 12,269 6 38.7 7 46.1 39.5 8 46.2 9 47.7 41.2 43.3 39.4 10 48.3 11 47.0 40.1 12 12,354 13,063 13,326 42.) 47.9 47.8 13 45.2 CHAPTER 4. REGRESSION (a) Develop a regression model to predict the price of stock 1 based on the Dow Jones Industrial Average. (b) Develop a regression model to predict the price of stock 2 based on the Dow Jones Industrial Average. (c) Which of the two stocks is most highly corre- lated to the Dow Jones Industrial Average over this time period? imanntant role in corn agri Step by Step Solution
There are 3 Steps involved in it
1 Expert Approved Answer
Step: 1 Unlock

Question Has Been Solved by an Expert!
Get step-by-step solutions from verified subject matter experts
Step: 2 Unlock
Step: 3 Unlock