

Question: I need help figuring or finding Outback (Blooming Brands) ratios for 2019, 2018 & 2017, and all ratios for Chick-fl-a. Some of them I've been
I need help figuring or finding Outback (Blooming Brands) ratios for 2019, 2018 & 2017, and all ratios for Chick-fl-a. Some of them I've been able to locate online, but others have not been as easy to find.
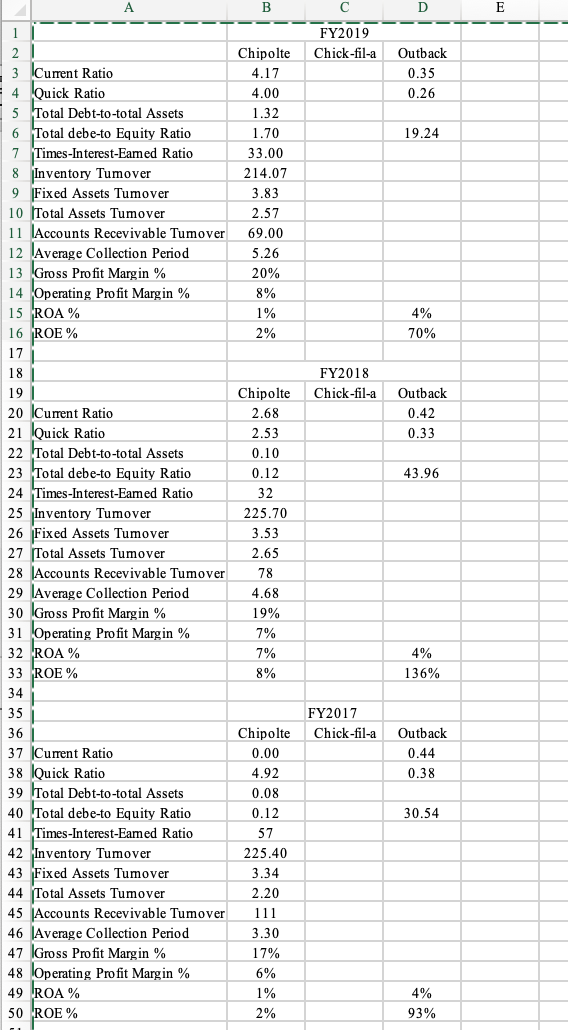
B E FY2019 Chick-fil-a Outback 0.35 0.26 19.24 1 2 3 Current Ratio 4 Quick Ratio 5 Total Debt-to-total Assets 6 Total debe-to Equity Ratio 7 Times-Interest-Eamed Ratio 8 Inventory Tumover 9 Fixed Assets Tumover 10 Total Assets Tumover 11 Accounts Recevivable Tumover 12 Average Collection Period 13 Gross Profit Margin % 14 Operating Profit Margin % 15 ROA% 16 ROE% 17 18 Chipolte 4.17 4.00 1.32 1.70 33.00 214.07 3.83 2.57 69.00 5.26 20% 8% 1% 2% 4% 70% FY2018 Chick-fil-a 19 Outback 0.42 0.33 43.96 Chipolte 2.68 2.53 0.10 0.12 32 225.70 3.53 2.65 78 4.68 19% 7% 7% 8% 4% 136% 20 Current Ratio 21 Quick Ratio 22 Total Debt-to-total Assets 23 Total debe-to Equity Ratio 24 Times Interest-Eamed Ratio 25 Inventory Tumover 26 Fixed Assets Tumover 27 Total Assets Tumover 28 Accounts Recevivable Tumover 29 Average Collection Period 30 Gross Profit Margin % 31 Operating Profit Margin % 32 ROA % 33 ROE% 34 35 36 37 Current Ratio 38 lQuick Ratio 39 Total Debt-to-total Assets 40 Total debe-to Equity Ratio 41 Times-Interest-Eamed Ratio 42 Inventory Tumover 43 Fixed Assets Tumover 44 Total Assets Tumover 45 Accounts Recevivable Tumover 46 Average Collection Period 47 Gross Profit Margin % 48 Operating Profit Margin % 49 ROA% 50 ROE% FY2017 Chick-fil-a Outback 0.44 0.38 30.54 Chipolte 0.00 4.92 0.08 0.12 57 225.40 3.34 2.20 111 3.30 17% 6% 1% 2% 4% 93% B E FY2019 Chick-fil-a Outback 0.35 0.26 19.24 1 2 3 Current Ratio 4 Quick Ratio 5 Total Debt-to-total Assets 6 Total debe-to Equity Ratio 7 Times-Interest-Eamed Ratio 8 Inventory Tumover 9 Fixed Assets Tumover 10 Total Assets Tumover 11 Accounts Recevivable Tumover 12 Average Collection Period 13 Gross Profit Margin % 14 Operating Profit Margin % 15 ROA% 16 ROE% 17 18 Chipolte 4.17 4.00 1.32 1.70 33.00 214.07 3.83 2.57 69.00 5.26 20% 8% 1% 2% 4% 70% FY2018 Chick-fil-a 19 Outback 0.42 0.33 43.96 Chipolte 2.68 2.53 0.10 0.12 32 225.70 3.53 2.65 78 4.68 19% 7% 7% 8% 4% 136% 20 Current Ratio 21 Quick Ratio 22 Total Debt-to-total Assets 23 Total debe-to Equity Ratio 24 Times Interest-Eamed Ratio 25 Inventory Tumover 26 Fixed Assets Tumover 27 Total Assets Tumover 28 Accounts Recevivable Tumover 29 Average Collection Period 30 Gross Profit Margin % 31 Operating Profit Margin % 32 ROA % 33 ROE% 34 35 36 37 Current Ratio 38 lQuick Ratio 39 Total Debt-to-total Assets 40 Total debe-to Equity Ratio 41 Times-Interest-Eamed Ratio 42 Inventory Tumover 43 Fixed Assets Tumover 44 Total Assets Tumover 45 Accounts Recevivable Tumover 46 Average Collection Period 47 Gross Profit Margin % 48 Operating Profit Margin % 49 ROA% 50 ROE% FY2017 Chick-fil-a Outback 0.44 0.38 30.54 Chipolte 0.00 4.92 0.08 0.12 57 225.40 3.34 2.20 111 3.30 17% 6% 1% 2% 4% 93%
Step by Step Solution
There are 3 Steps involved in it

Get step-by-step solutions from verified subject matter experts