

Question: I need help figuring out how to do these homework questions, thanks! This Question: 1 pt 23 of 24 (5 complete) This Test: 37 pts
I need help figuring out how to do these homework questions, thanks!
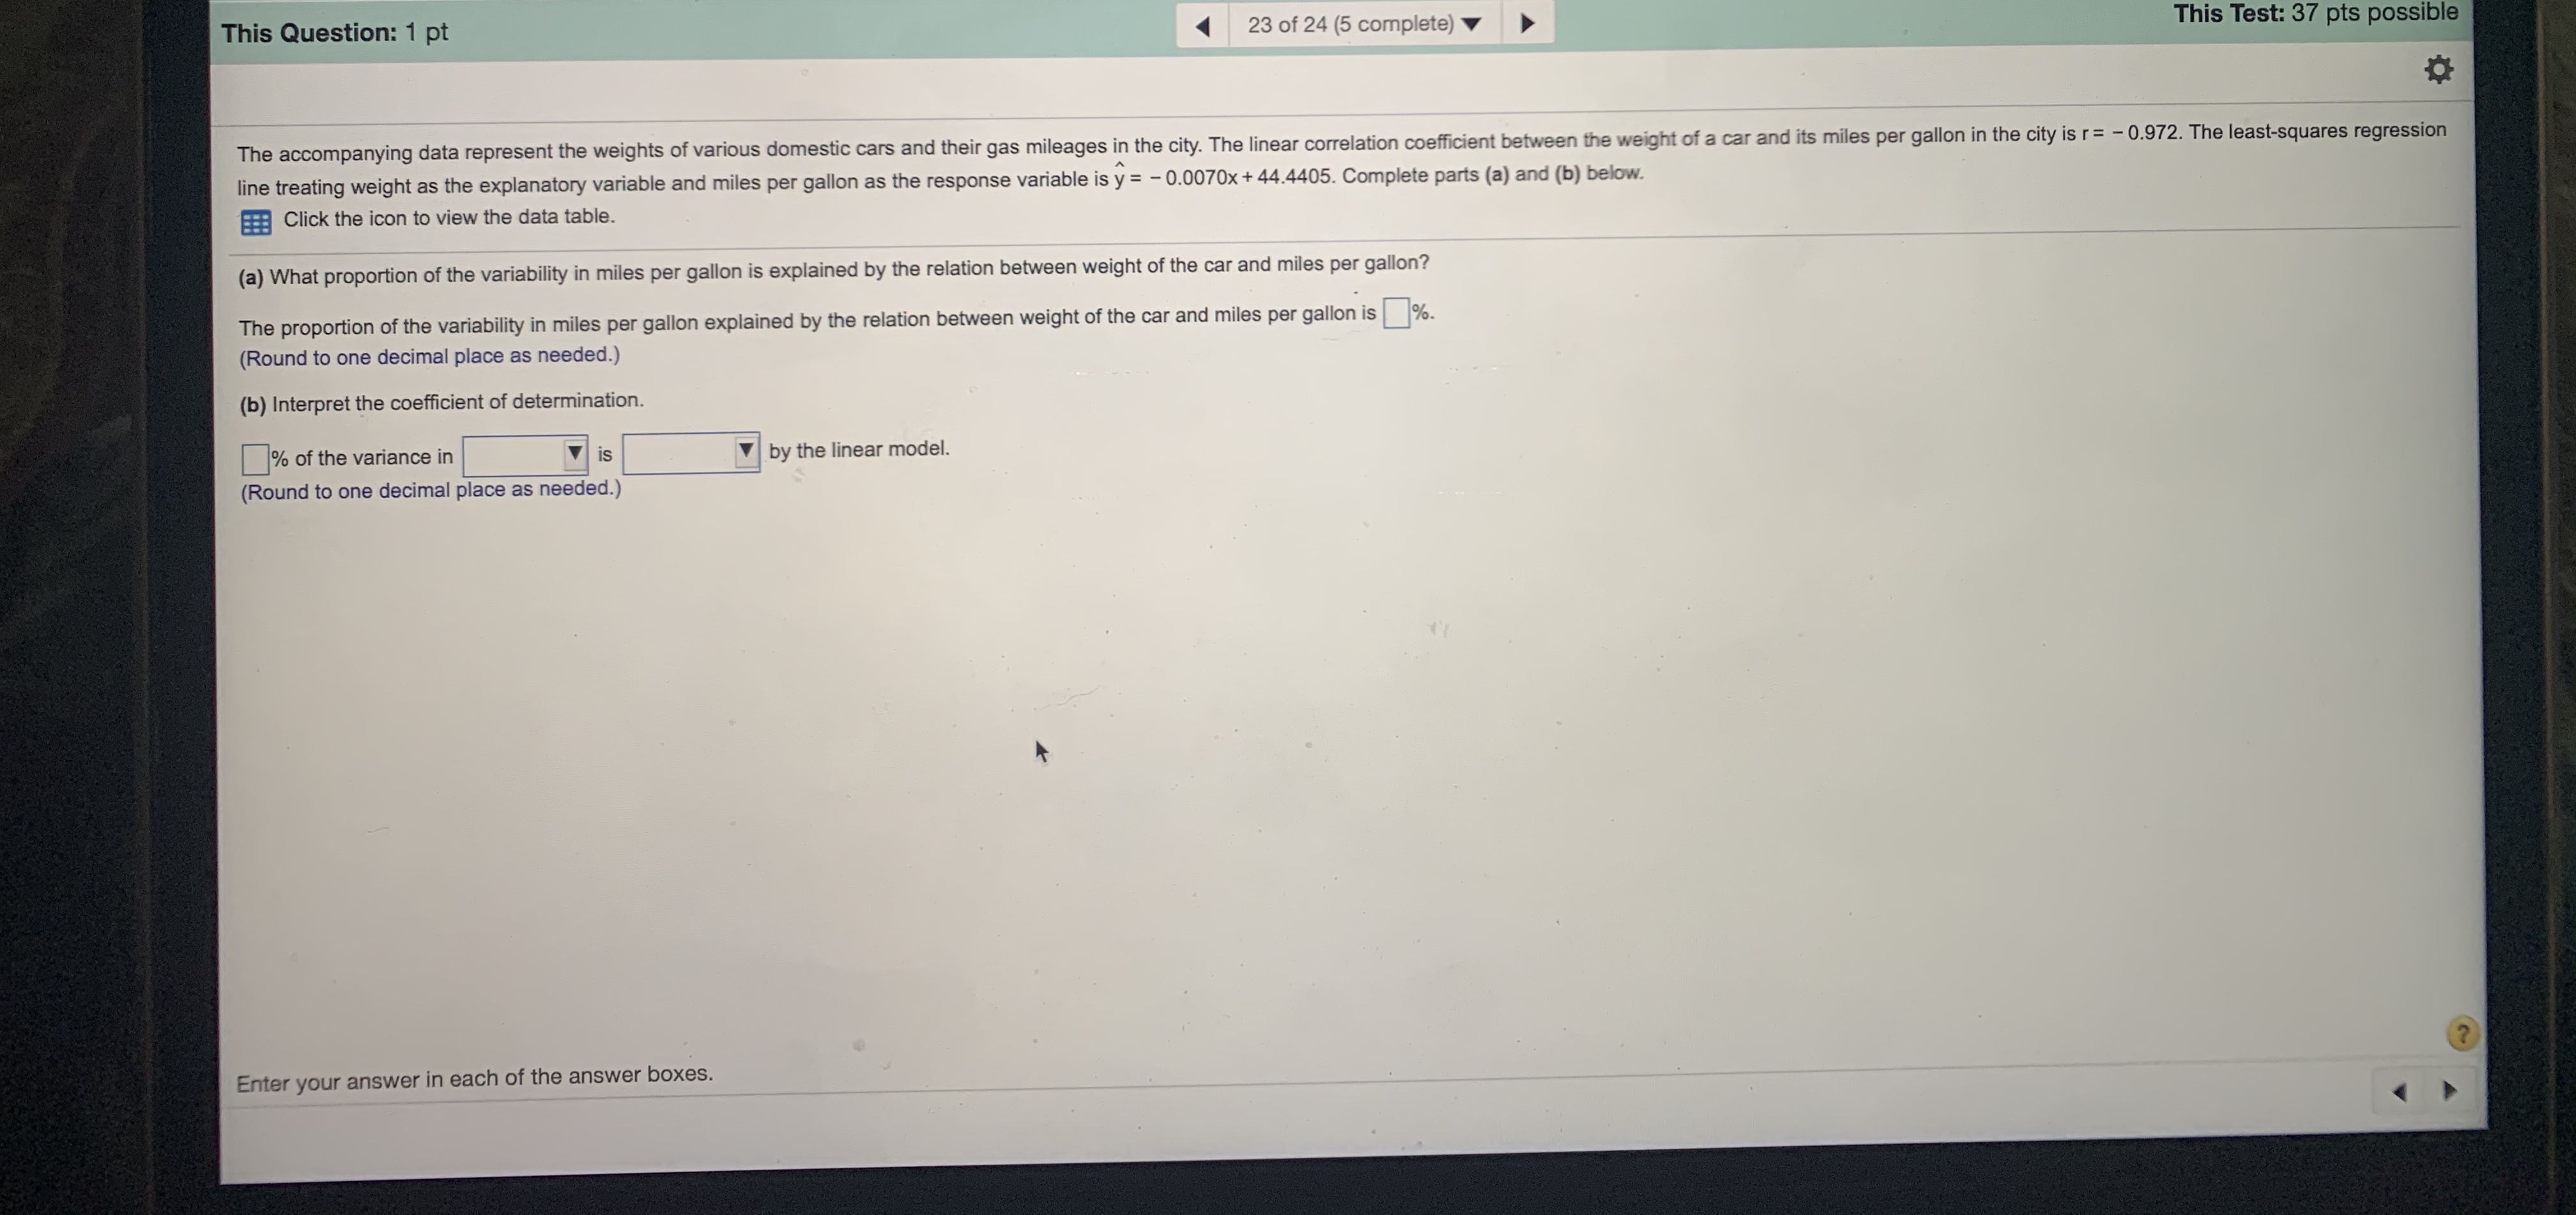
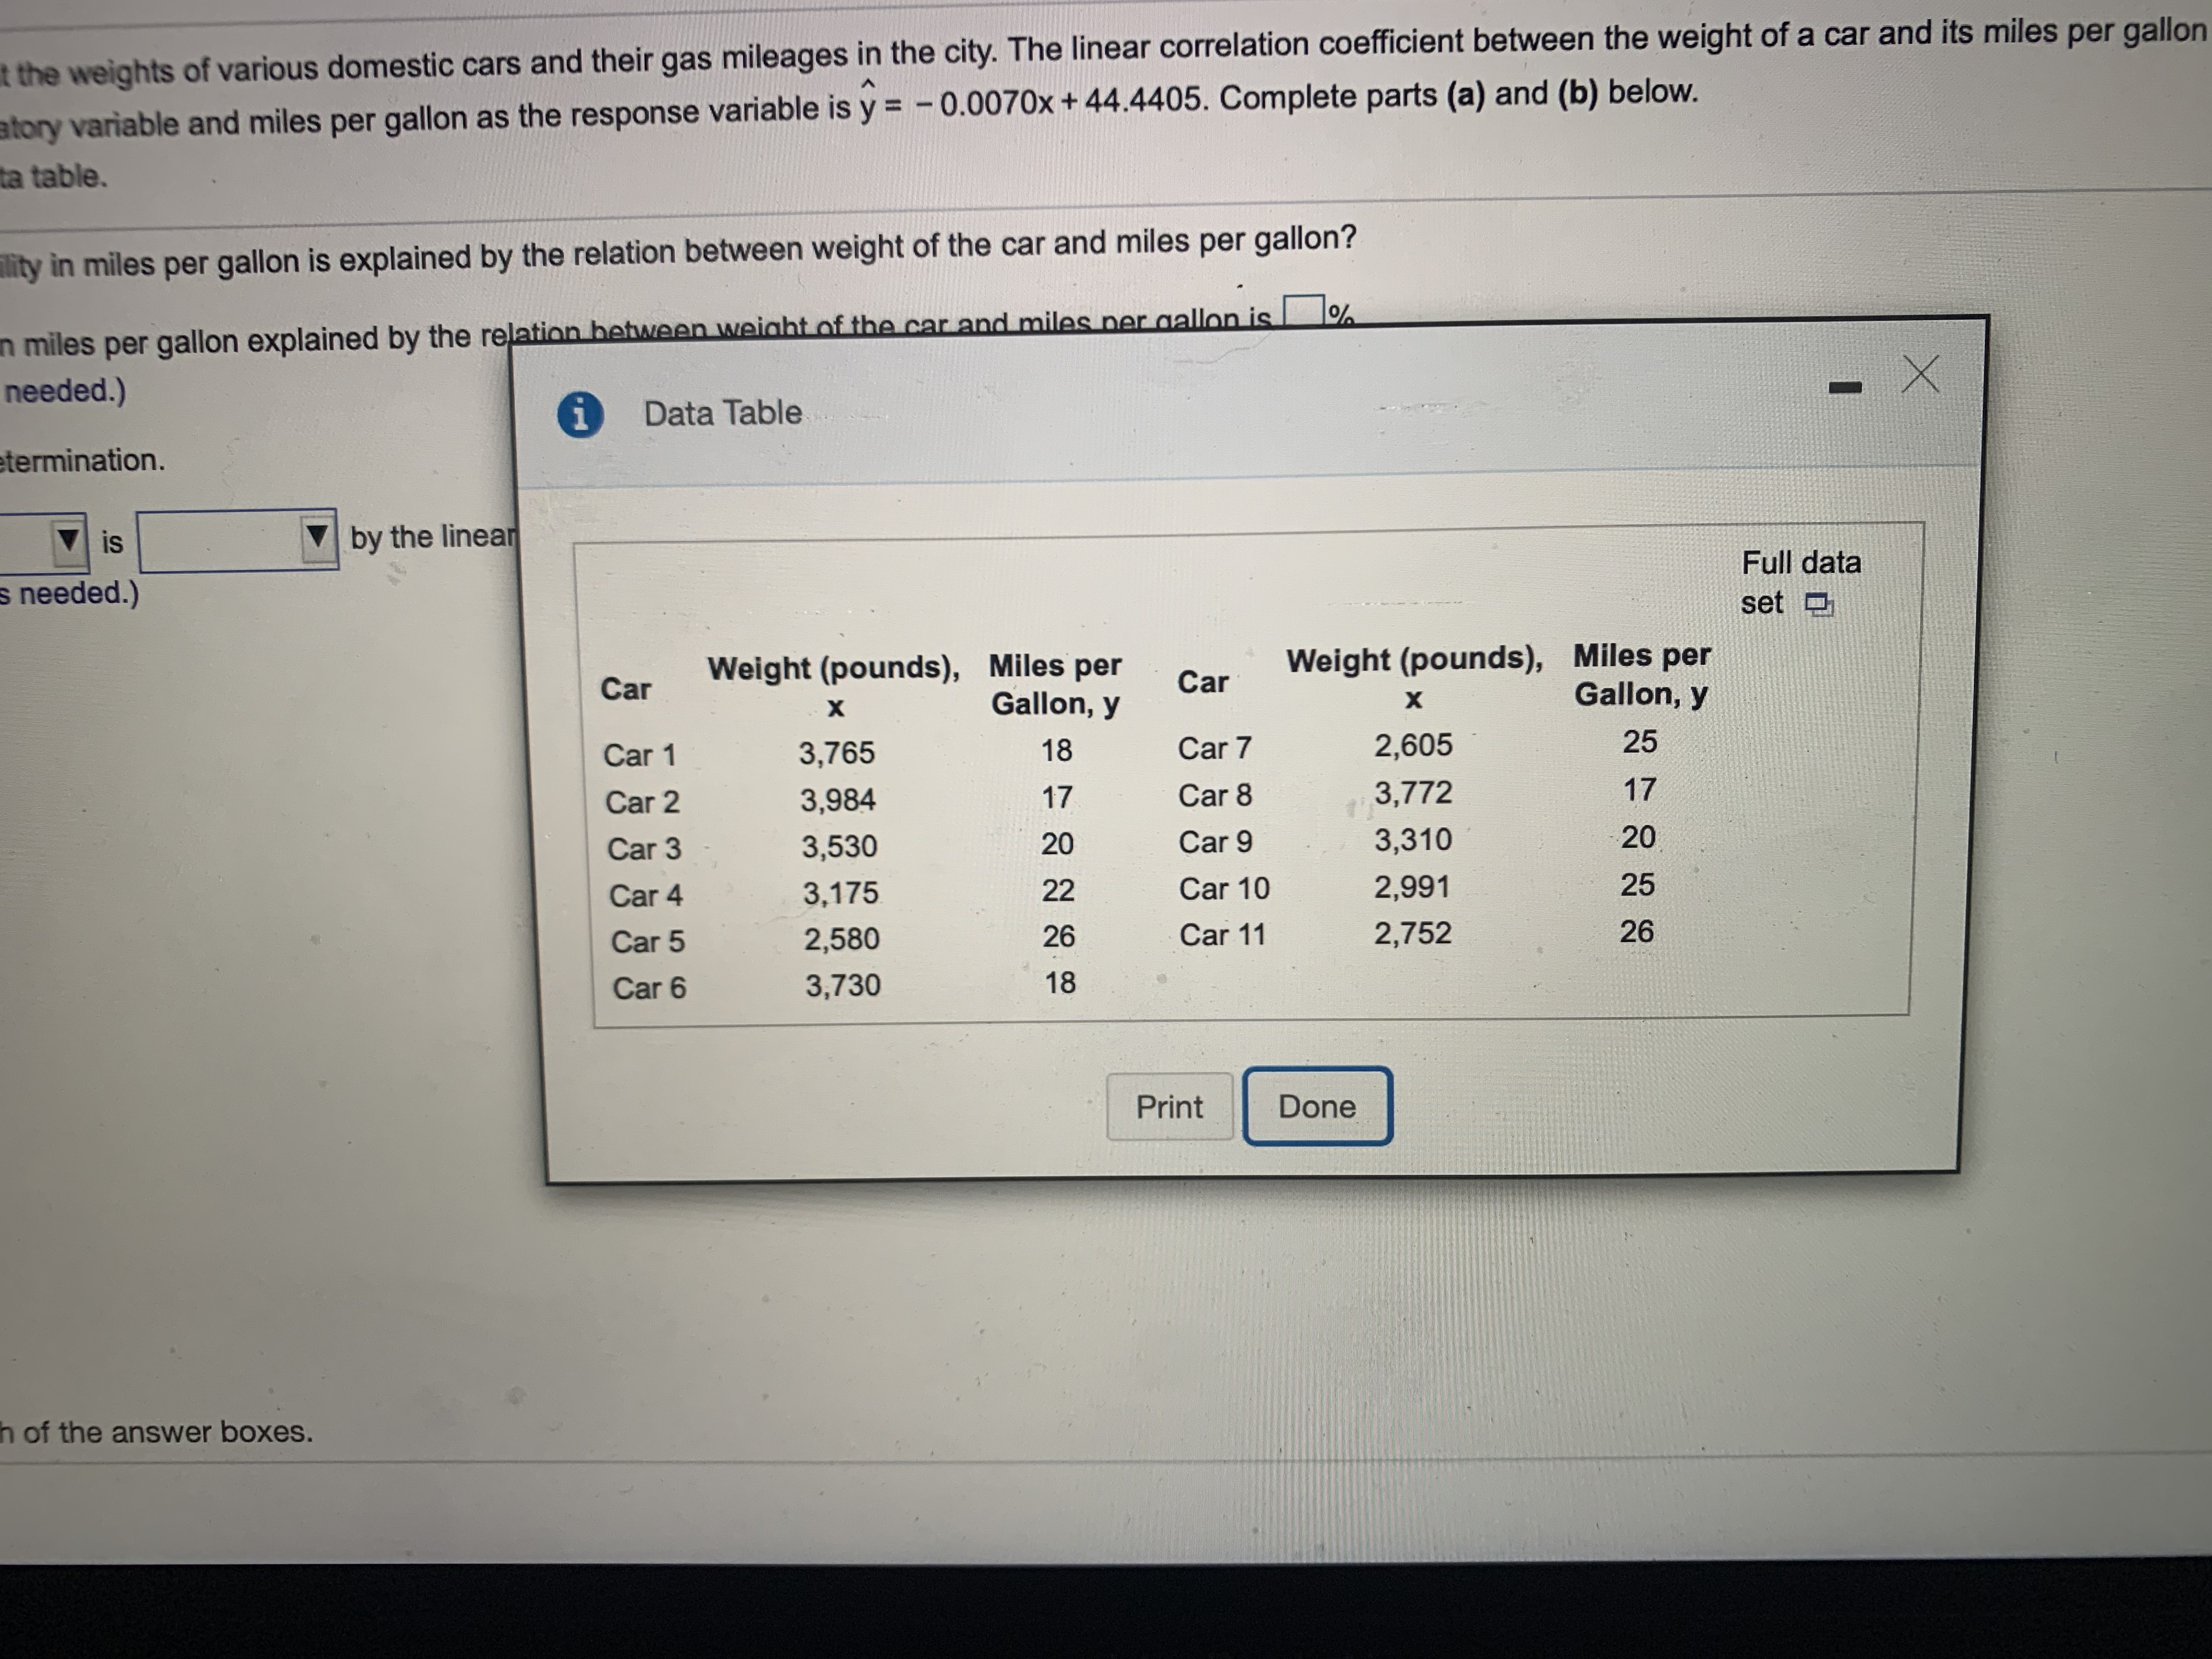
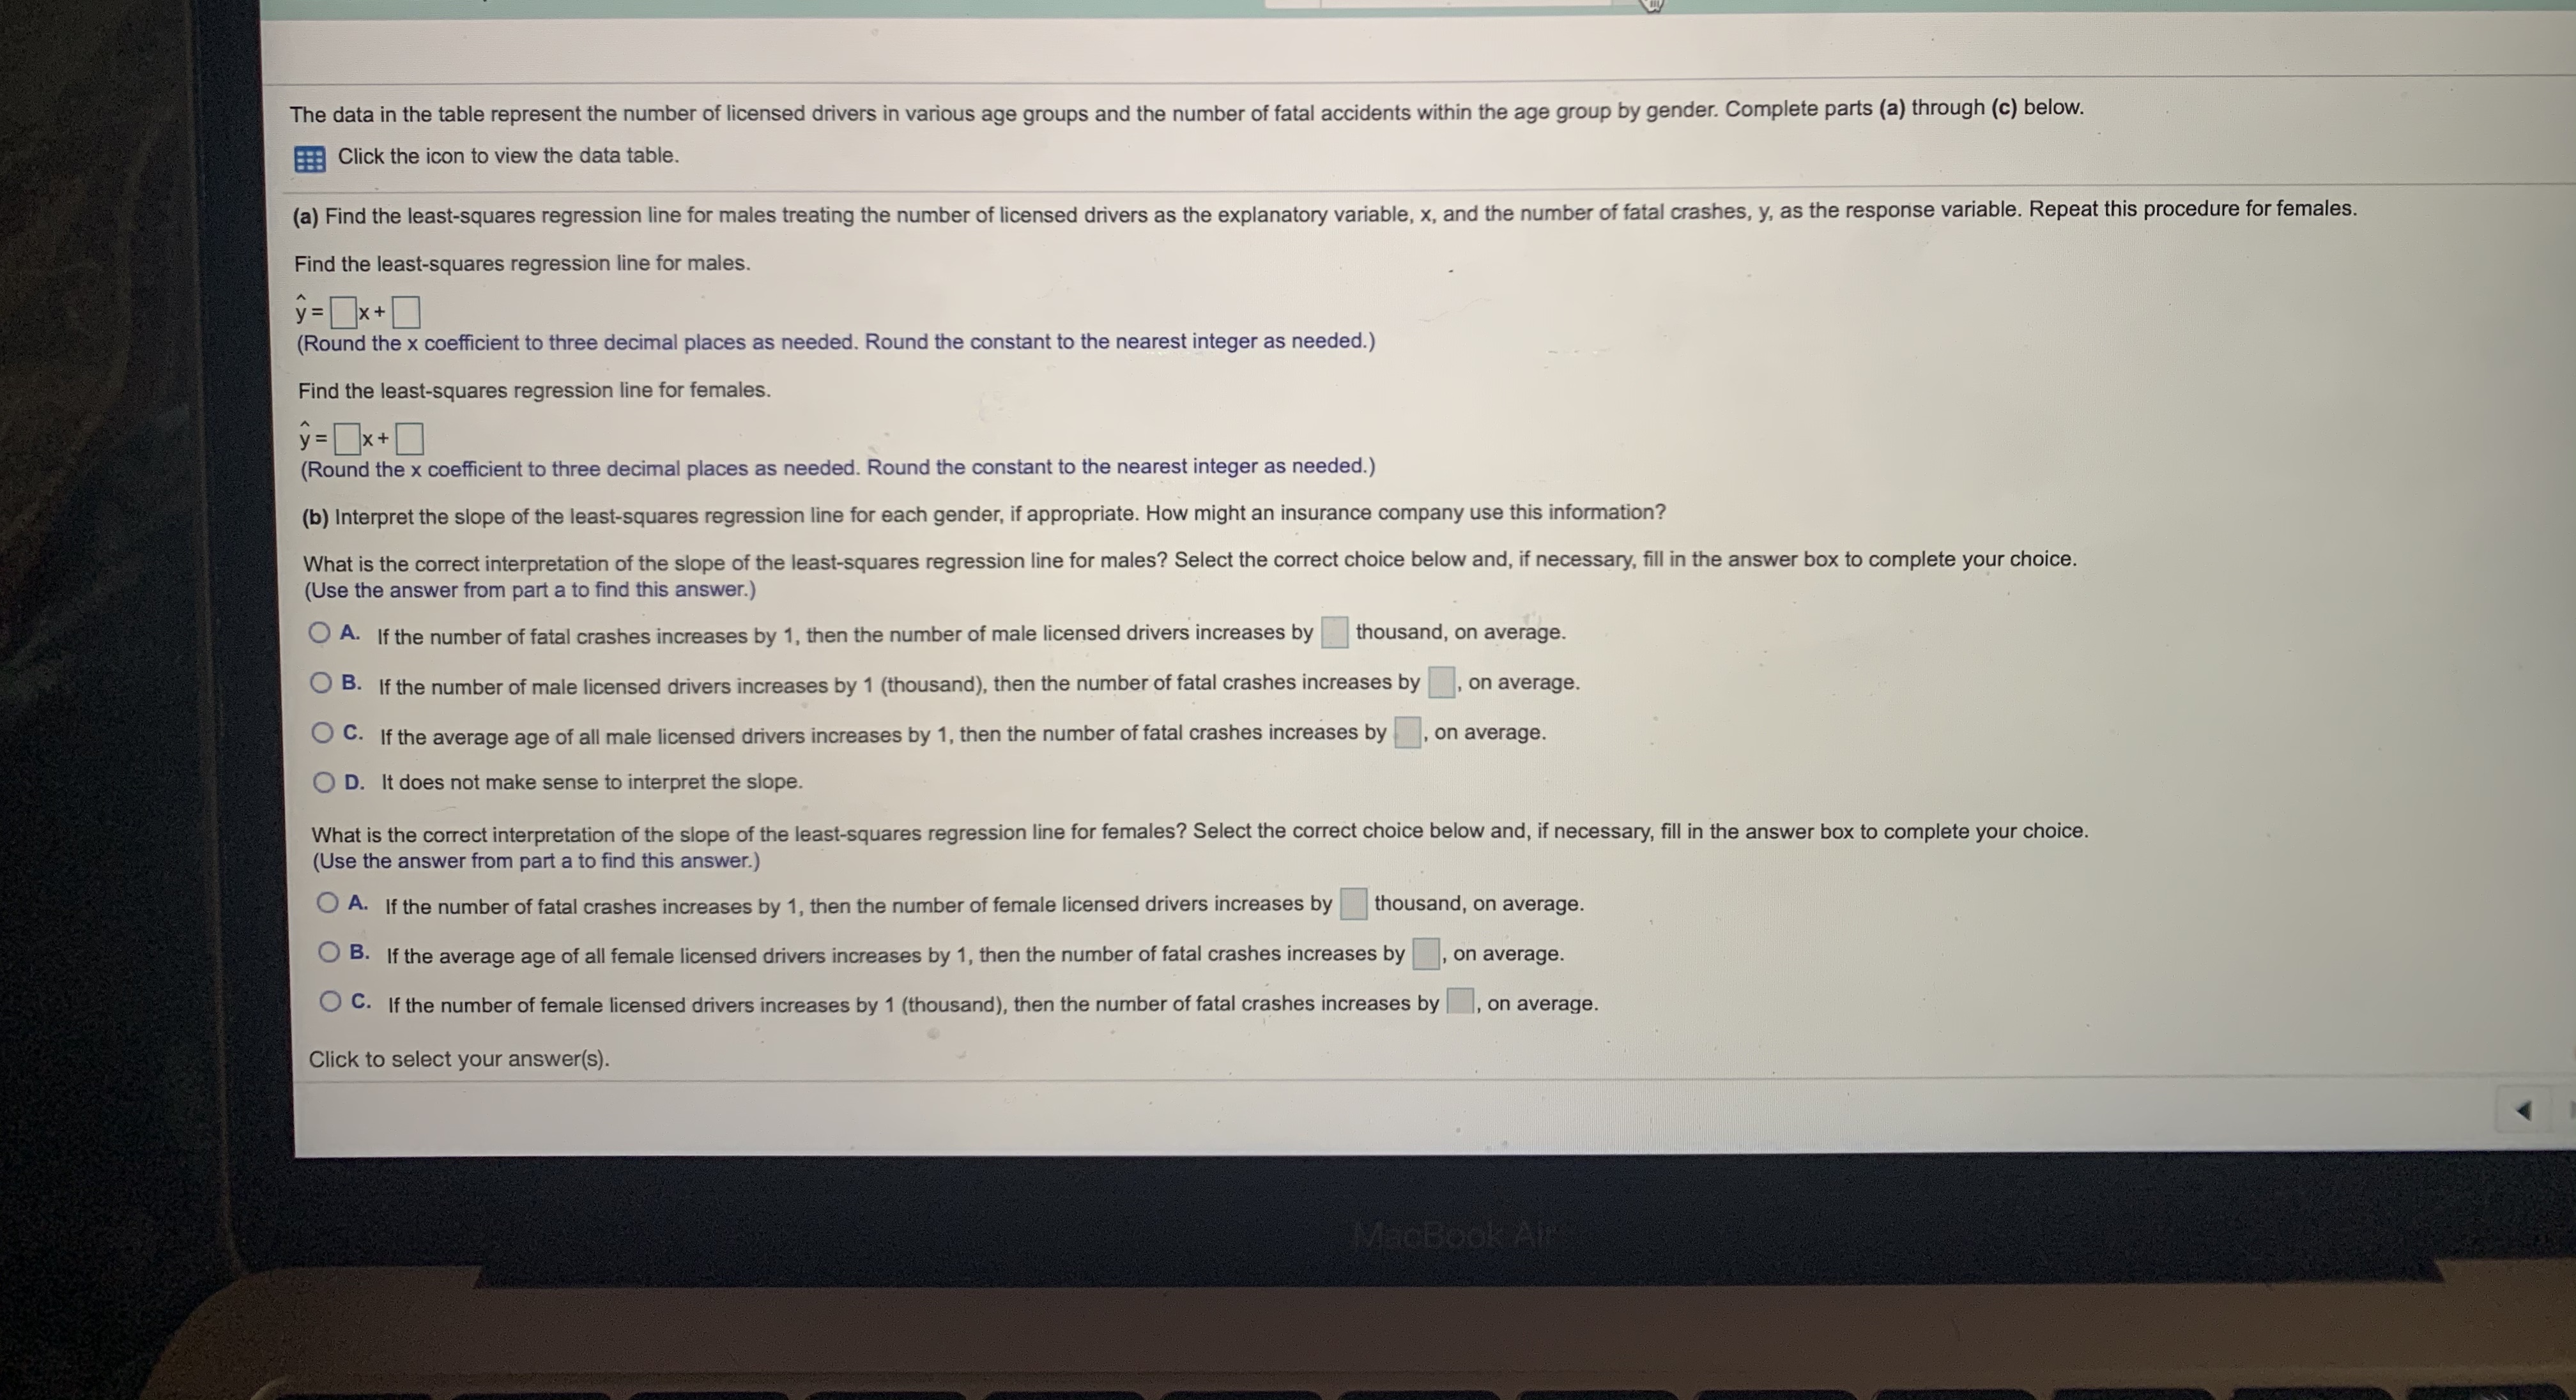
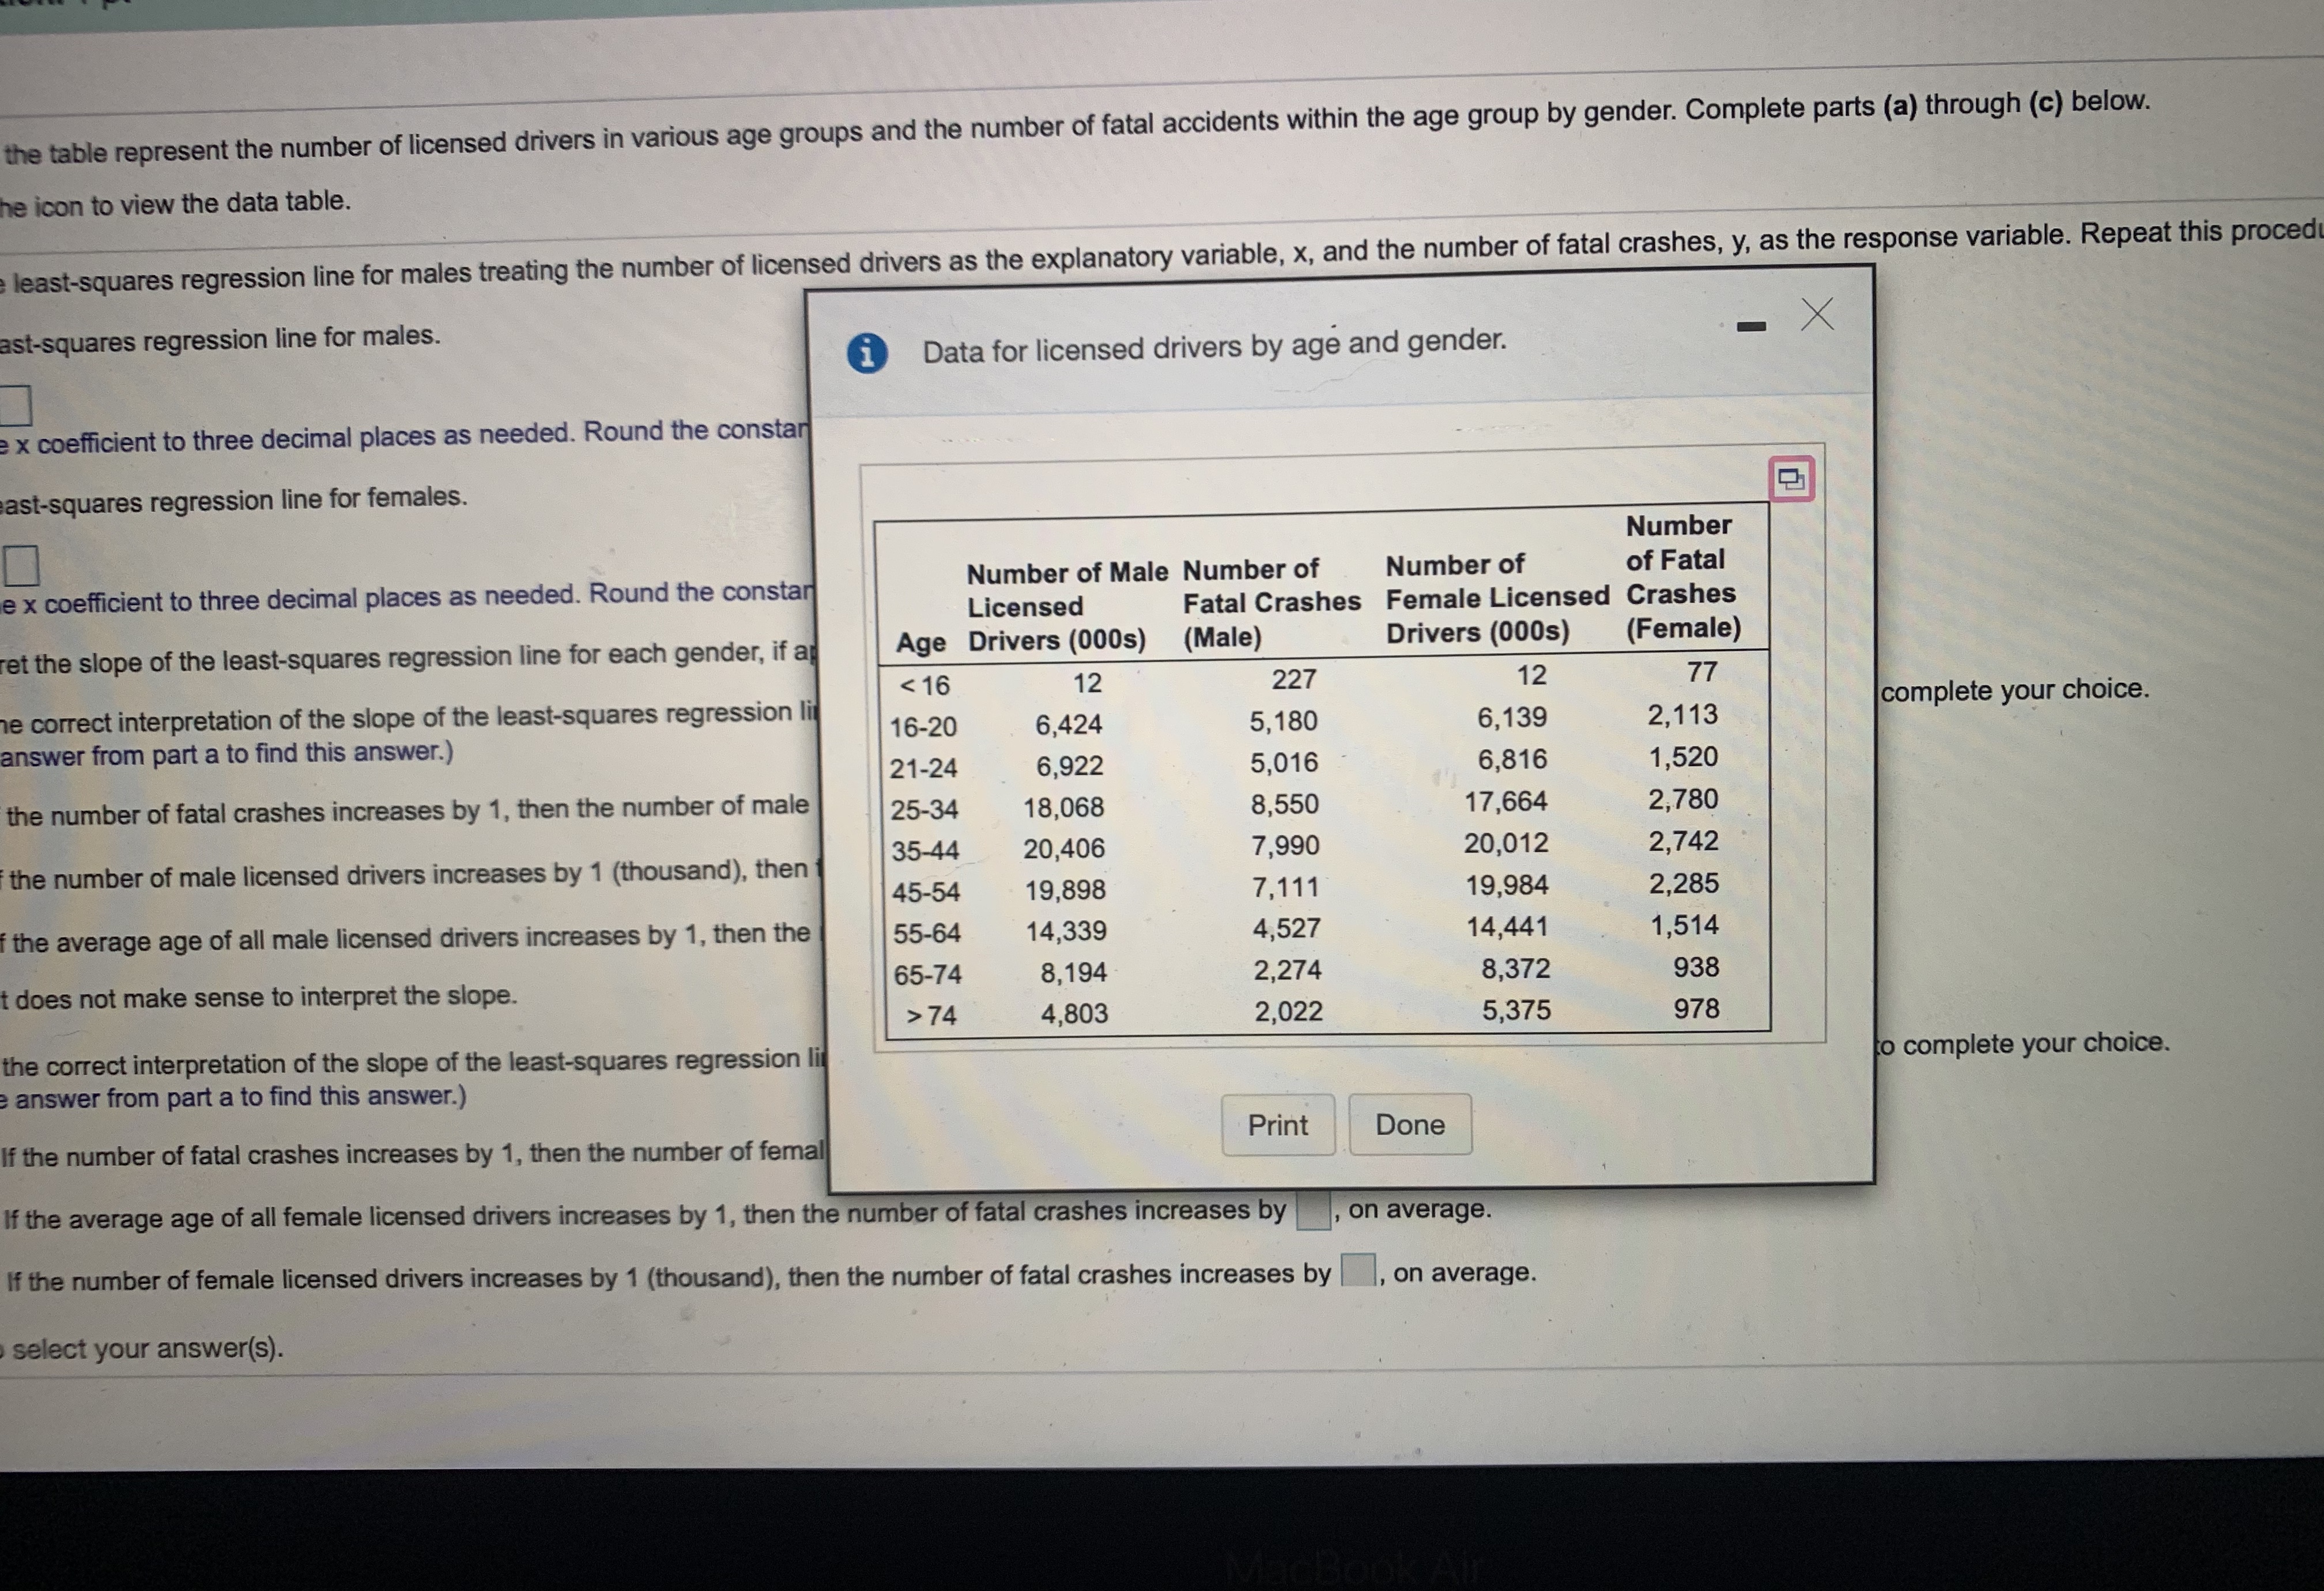
This Question: 1 pt 23 of 24 (5 complete) This Test: 37 pts possible The accompanying data represent the weights of various domestic cars and their gas mileages in the city. The linear correlation coefficient between the weight of a car and its miles per gallon in the city is r= - 0.972. The least-squares regression line treating weight as the explanatory variable and miles per gallon as the response variable is y = - 0.0070x + 44.4405. Complete parts (a) and (b) below. Click the icon to view the data table. (a) What proportion of the variability in miles per gallon is explained by the relation between weight of the car and miles per gallon? The proportion of the variability in miles per gallon explained by the relation between weight of the car and miles per gallon is%. (Round to one decimal place as needed.) (b) Interpret the coefficient of determination. % of the variance in is by the linear model. (Round to one decimal place as needed.) Enter your answer in each of the answer boxes. ?the weights of various domestic cars and their gas mileages in the city. The linear correlation coefficient between the weight of a car and its miles per gallon atory variable and miles per gallon as the response variable is y = - 0.0070x + 44.4405. Complete parts (a) and (b) below. ta table. lity in miles per gallon is explained by the relation between weight of the car and miles per gallon? n miles per gallon explained by the relation between weight of the car and miles per gallon is% needed.) i Data Table X termination. is by the linear s needed.) Full data set Car Weight (pounds), Miles per Weight (pounds), Miles per X Gallon, y Car Gallon, y Car 1 3,765 18 Car 7 2,605 25 Car 2 3,984 17 Car 8 3,772 17 Car 3 3,530 20 Car 9 3,310 20 Car 4 3,175 22 Car 10 2,991 25 Car 5 2,580 26 Car 11 2,752 26 Car 6 3,730 18 Print Done h of the answer boxes.The data in the table represent the number of licensed drivers in various age groups and the number of fatal accidents within the age group by gender. Complete parts (a) through (c) below. Click the icon to view the data table. (a) Find the least-squares regression line for males treating the number of licensed drivers as the explanatory variable, x, and the number of fatal crashes, y, as the response variable. Repeat this procedure for females. Find the least-squares regression line for males. y =[x + 0 (Round the x coefficient to three decimal places as needed. Round the constant to the nearest integer as needed.) Find the least-squares regression line for females. y = [x+ 0 (Round the x coefficient to three decimal places as needed. Round the constant to the nearest integer as needed.) (b) Interpret the slope of the least-squares regression line for each gender, if appropriate. How might an insurance company use this information? What is the correct interpretation of the slope of the least-squares regression line for males? Select the correct choice below and, if necessary, fill in the answer box to complete your choice. (Use the answer from part a to find this answer.) A. If the number of fatal crashes increases by 1, then the number of male licensed drivers increases by thousand, on average. O B. If the number of male licensed drivers increases by 1 (thousand), then the number of fatal crashes increases by , on average. O C. If the average age of all male licensed drivers increases by 1, then the number of fatal crashes increases by , on average. O D. It does not make sense to interpret the slope. What is the correct interpretation of the slope of the least-squares regression line for females? Select the correct choice below and, if necessary, fill in the answer box to complete your choice. (Use the answer from part a to find this answer.) O A. If the number of fatal crashes increases by 1, then the number of female licensed drivers increases by thousand, on average. O B. If the average age of all female licensed drivers increases by 1, then the number of fatal crashes increases by , on average. O C. If the number of female licensed drivers increases by 1 (thousand), then the number of fatal crashes increases by | |, on average. Click to select your answer(s). MacBook Allythe table represent the number of licensed drivers in various age groups and the number of fatal accidents within the age group by gender. Complete parts (a) through (c) below. e icon to view the data table. least-squares regression line for males treating the number of licensed drivers as the explanatory variable, x, and the number of fatal crashes, y, as the response variable. Repeat this proced ast-squares regression line for males. Data for licensed drivers by age and gender. X x coefficient to three decimal places as needed. Round the constan ast-squares regression line for females. Number e x coefficient to three decimal places as needed. Round the constar Number of Male Number of Number of of Fatal Licensed Fatal Crashes Female Licensed Crashes et the slope of the least-squares regression line for each gender, if ap Age Drivers (000s) (Male) Drivers (000s) (Female) e correct interpretation of the slope of the least-squares regression lit
Step by Step Solution
There are 3 Steps involved in it

Get step-by-step solutions from verified subject matter experts