

Question: I need help figuring out this question for data analysis. Universities and colleges do not like to admit students who do not perform well. It
I need help figuring out this question for data analysis.
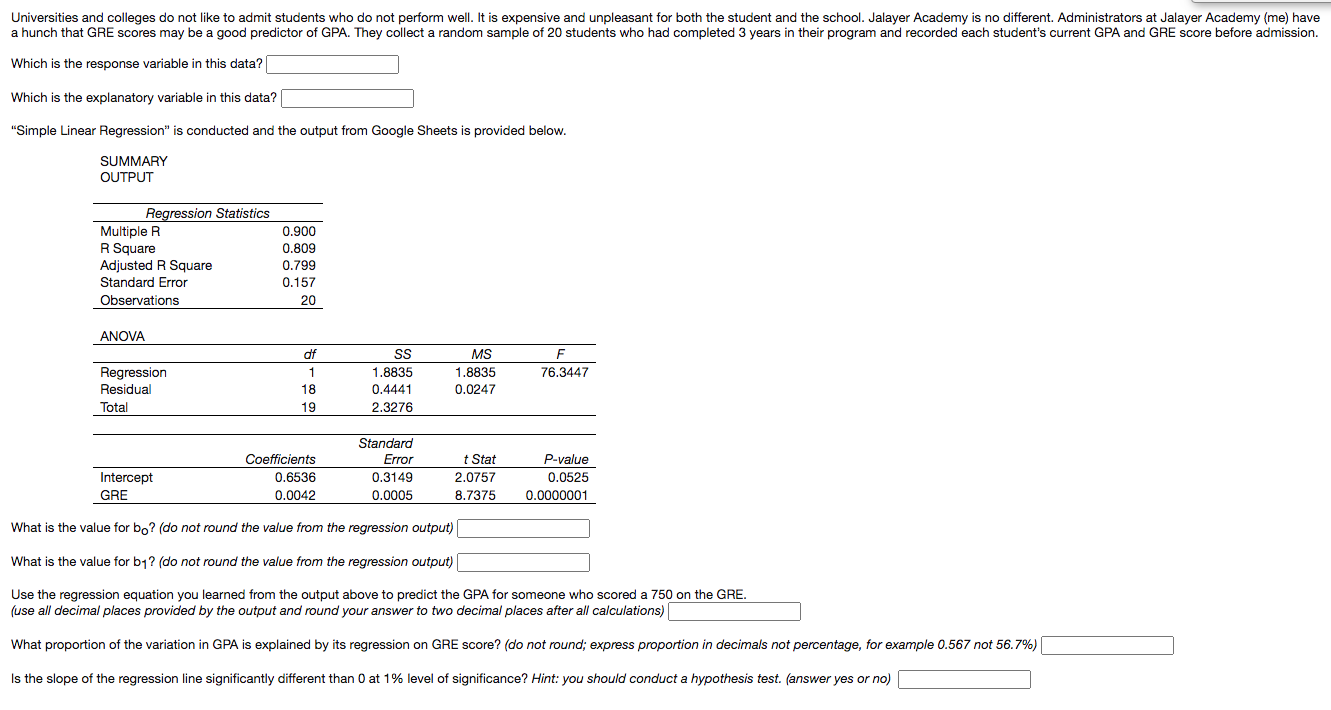
Universities and colleges do not like to admit students who do not perform well. It is expensive and unpleasant for both the student and the school. Jalayer Academy is no different. Administrators at Jalayer Academy (me) have a hunch that GRE scores may be a good predictor of GPA. They collect a random sample of 20 students who had completed 3 years in their program and recorded each student's current GPA and GRE score before admission. Which is the response variable in this data? Which is the explanatory variable in this data? "Simple Linear Regression" is conducted and the output from Google Sheets is provided below. SUMMARY OUTPUT Regression Statistics Multiple R 0.900 R Square 0.809 Adjusted R Square 0.799 Standard Error 0.157 Observations 20 ANOVA df SS MS F Regression 1 1.8835 1.8835 76.3447 Residual 18 0.4441 0.0247 Total 19 2.3276 Standard Coefficients Error t Stat P-value Intercept 0.6536 0.3149 2.0757 0.0525 GRE 0.0042 0.0005 8.7375 0.0000001 What is the value for bo? (do not round the value from the regression output) What is the value for by? (do not round the value from the regression output) Use the regression equation you learned from the output above to predict the GPA for someone who scored a 750 on the GRE. (use all decimal places provided by the output and round your answer to two decimal places after all calculations) What proportion of the variation in GPA is explained by its regression on GRE score? (do not round; express proportion in decimals not percentage, for example 0.567 not 56.7%) Is the slope of the regression line significantly different than 0 at 1% level of significance? Hint: you should conduct a hypothesis test. (answer yes or no)
Step by Step Solution
There are 3 Steps involved in it

Get step-by-step solutions from verified subject matter experts