

Question: i need help filling out this chart based on the information provided. it would be helpful to include calculations for the numbers entered. thanks! First,
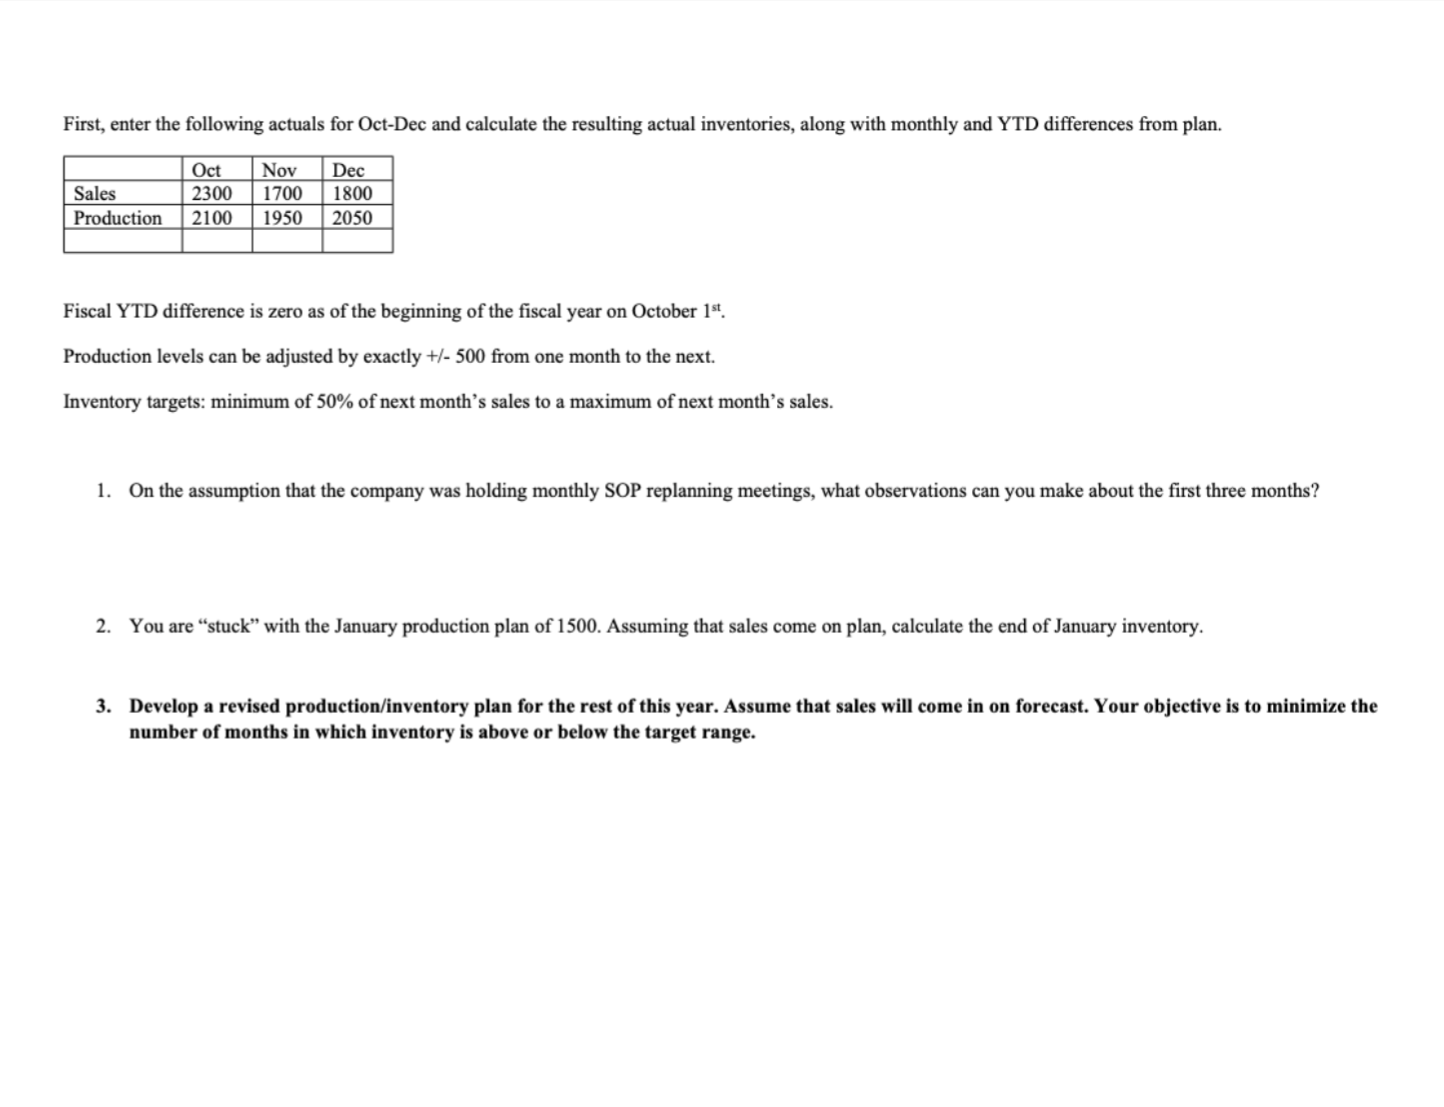
i need help filling out this chart based on the information provided. it would be helpful to include calculations for the numbers entered. thanks! First, enter the following actuals for OctDec and calculate the resulting actual inventories, along with monthly and YTD differences from plan.
Fiscal YTD difference is zero as of the beginning of the fiscal year on October text st
Production levels can be adjusted by exactly from one month to the next.
Inventory targets: minimum of of next month's sales to a maximum of next month's sales.
On the assumption that the company was holding monthly SOP replanning meetings, what observations can you make about the first three months?
You are "stuck" with the January production plan of Assuming that sales come on plan, calculate the end of January inventory.
Develop a revised productioninventory plan for the rest of this year. Assume that sales will come in on forecast. Your objective is to minimize the number of months in which inventory is above or below the target range. SOP Planning Grid MTS Environment
Monthend inventory limits: maxnext month's sales; min of next month's sales
Monthtomonth production level changes: exactly, no other increments
begintabularccccccccccccccc
hline & & & & & & & & & & & & & &
hline Product Family A & & & N & D & J & F & M & A & M & J & J & A & S & total
hline Sales Plan & & & & & & & & & & & & & &
hline multicolumnlActual Sales
hline multicolumnlDifference
hline multicolumnlCumulative Diff.
hline & & & & & & & & & & & & & &
hline Production Plan & & & & & & & & & & & & & &
hline multicolumnlProd Plan Revised
hline multicolumnlActual Production
hline multicolumnlDifference
hline multicolumnlCumulative Diff.
hline Inventory Plan & & & & & & & & & & & & & &
hline Inv. Plan Revised & & & & & & & & & & & & & &
hline Actual Inventory & & & & & & & & & & & & & &
hline multicolumnlDifference
hline & & & Inventory & targets & max & & & & & & & & &
hline actual inventory as & Sept. & th & & & min & & & & & & & & &
hline
endtabular
Step by Step Solution
There are 3 Steps involved in it
1 Expert Approved Answer
Step: 1 Unlock

Question Has Been Solved by an Expert!
Get step-by-step solutions from verified subject matter experts
Step: 2 Unlock
Step: 3 Unlock