

Question: I need help filling out this spreadsheet: This is the financial information about Tesla Inc.: 10K for first values until OI -> Older 10K to
I need help filling out this spreadsheet: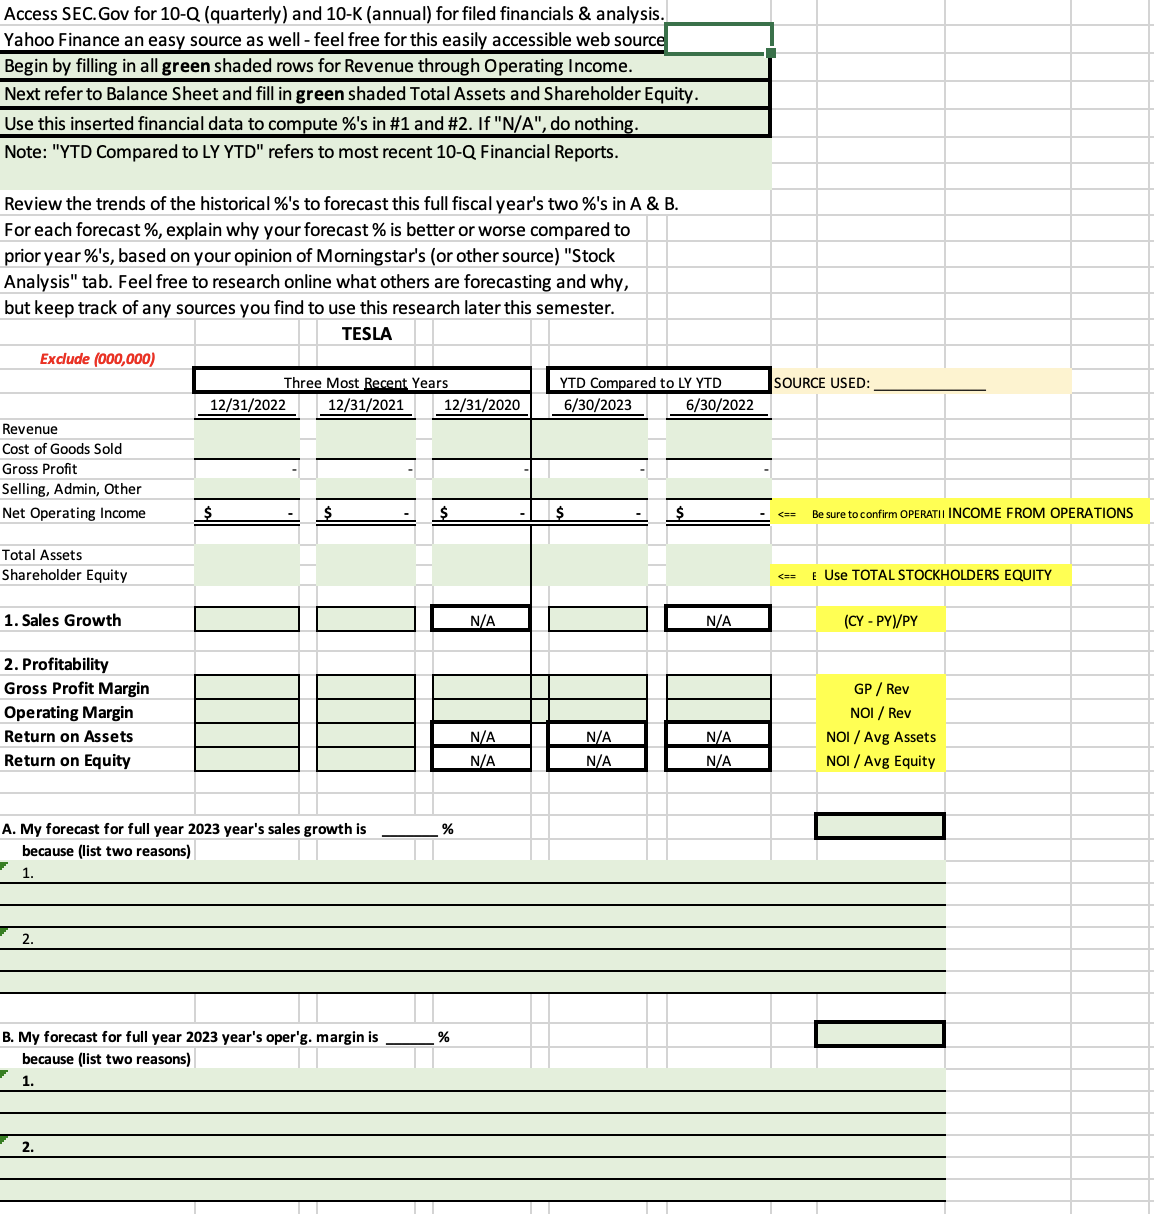
This is the financial information about Tesla Inc.:
- 10K for first values until OI -> Older 10K to get third row for total assets and stockholders equity
- 10Q youre gonna need 2 10Q -> until OI then 2 10Qs only give you current quarter end and fiscal years end -> for total assets and stockholders equity you will need earlier 10Q to retrieve balance sheet
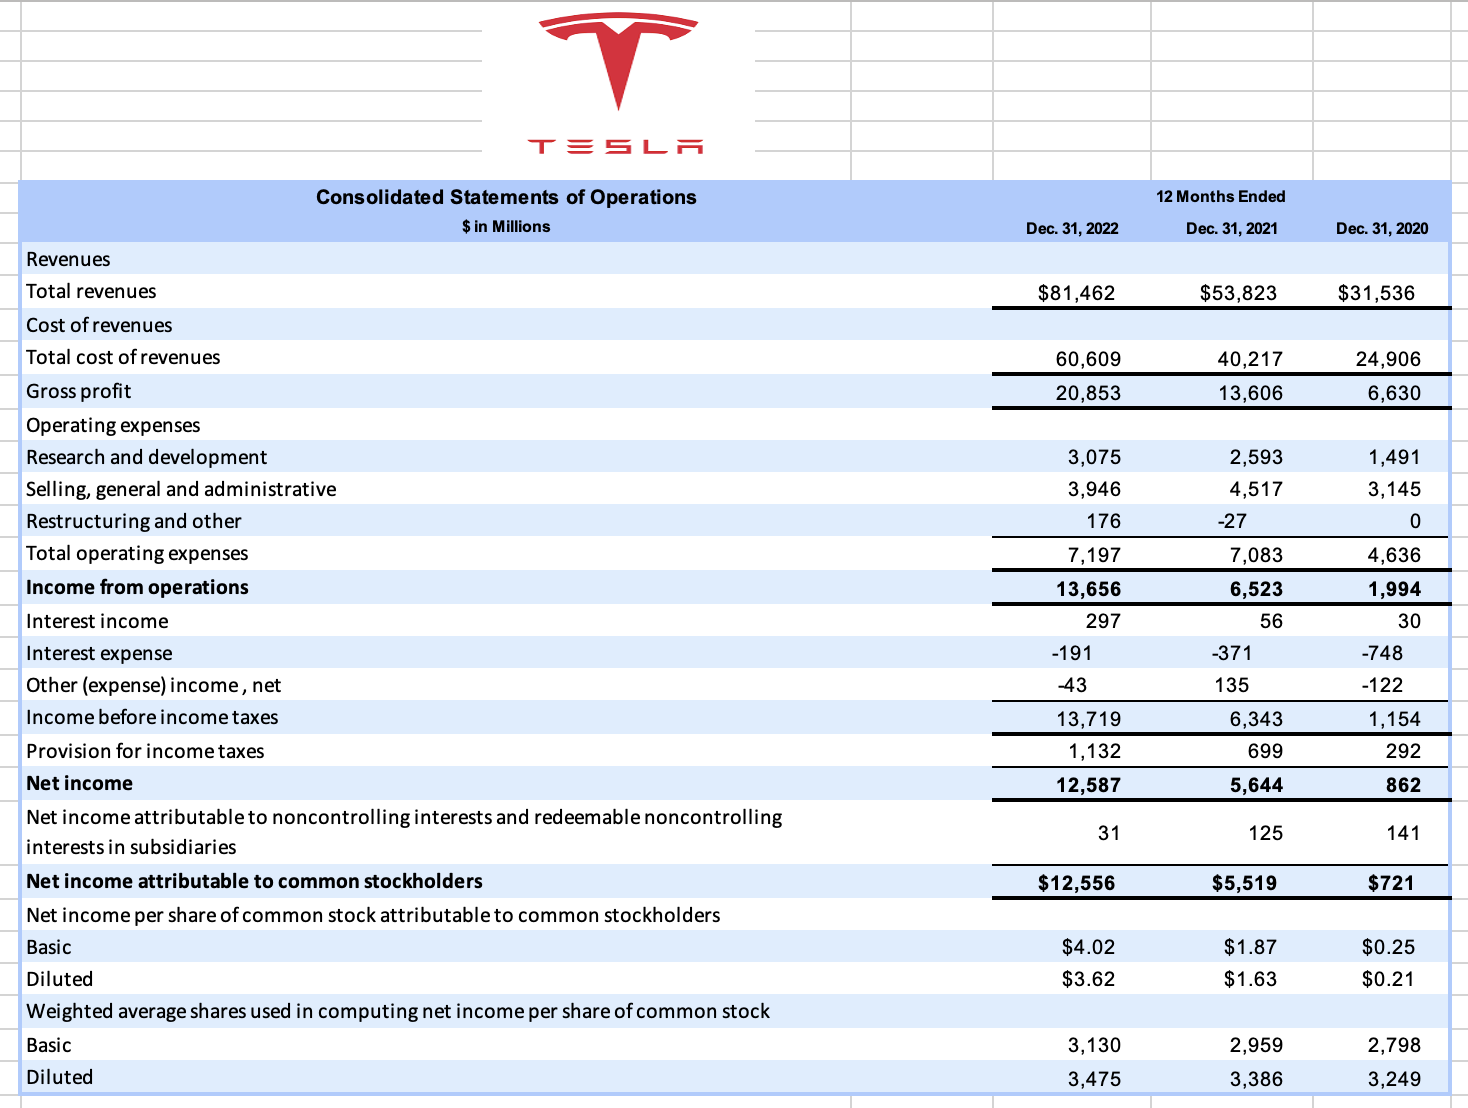
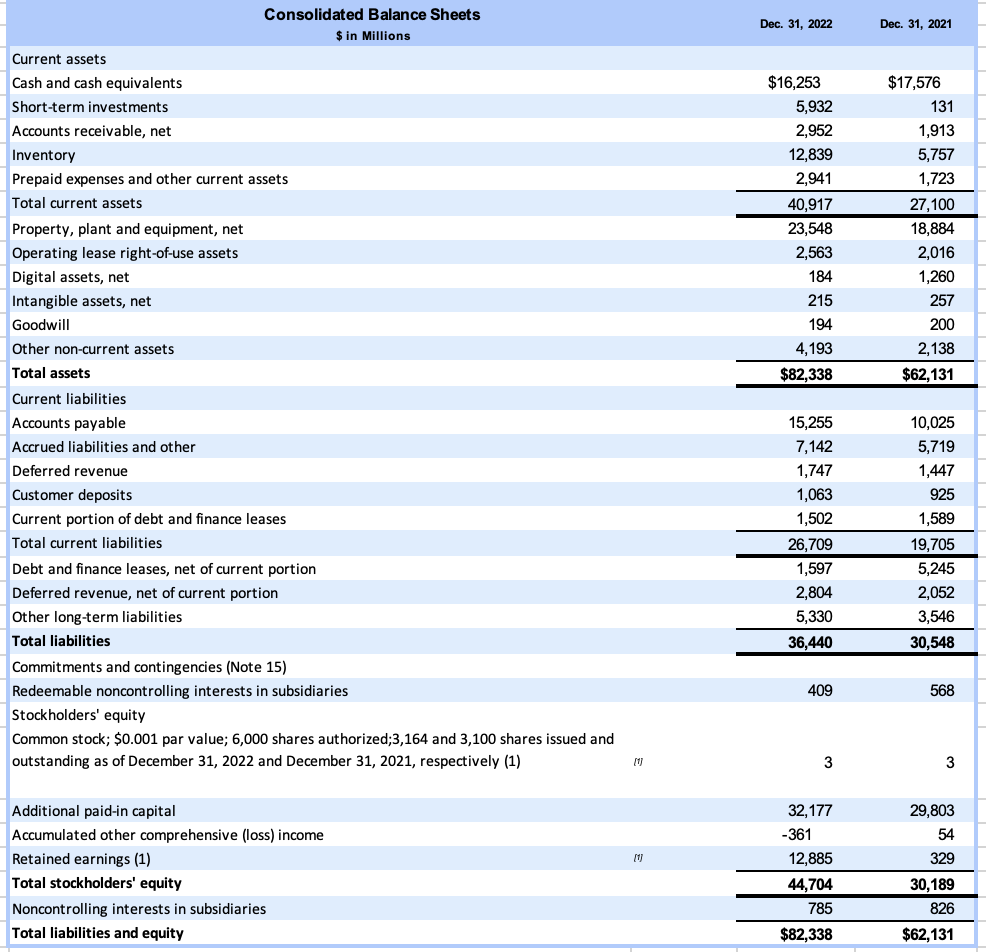
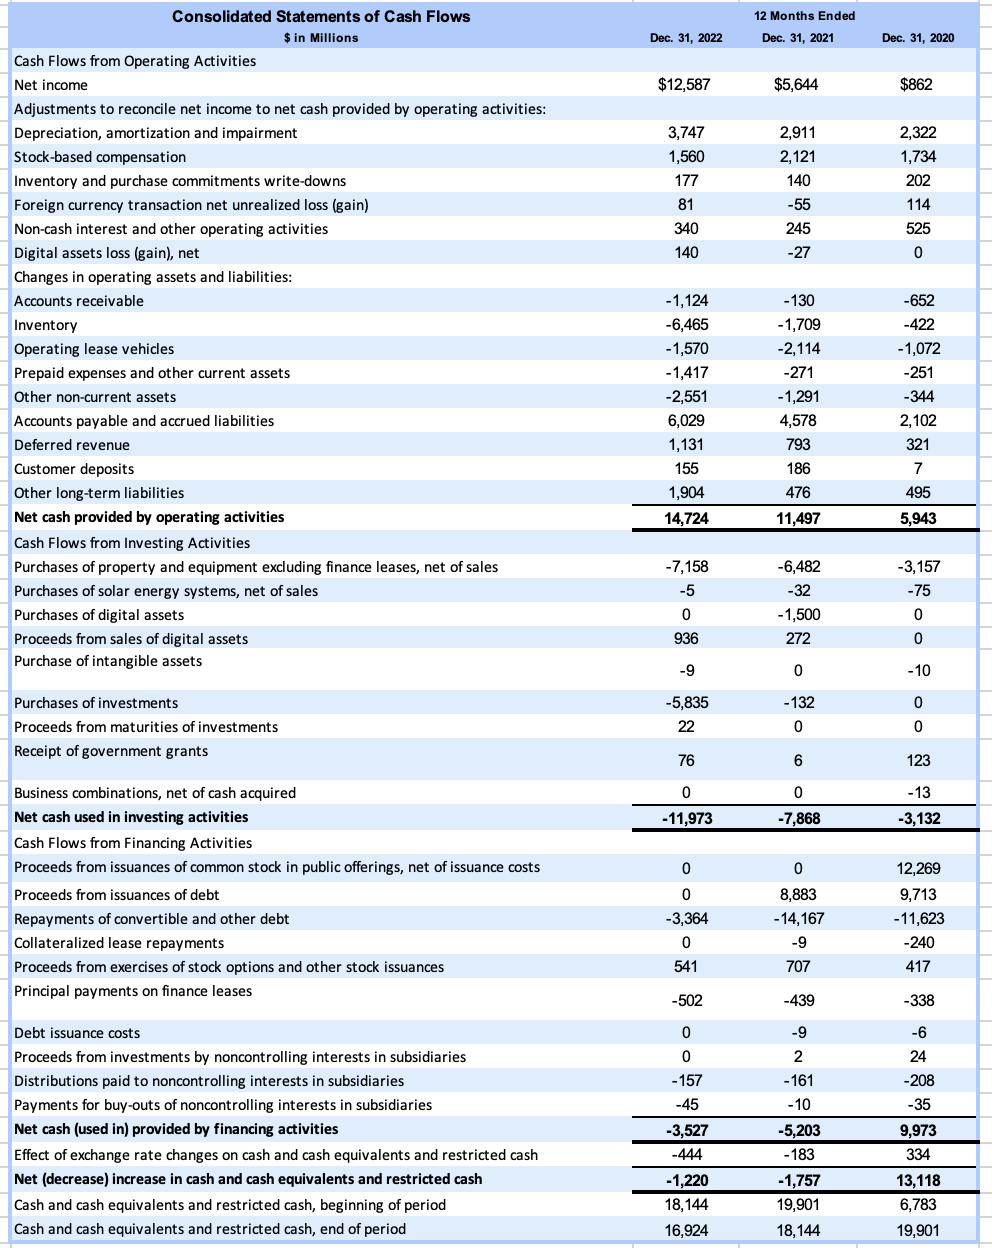
\begin{tabular}{|c|c|c|c|} \hline \multicolumn{2}{|l|}{ConsolidatedBalanceSheets$inMillions} & Dec. 31, 2022 & Dec. 31, 2021 \\ \hline \multicolumn{4}{|l|}{ Current assets } \\ \hline Cash and cash equivalents & & $16,253 & $17,576 \\ \hline Short-term investments & & 5,932 & 131 \\ \hline Accounts receivable, net & & 2,952 & 1,913 \\ \hline Inventory & & 12,839 & 5,757 \\ \hline Prepaid expenses and other current assets & & 2,941 & 1,723 \\ \hline Total current assets & & 40,917 & 27,100 \\ \hline Property, plant and equipment, net & & 23,548 & 18,884 \\ \hline Operating lease right-of-use assets & & 2,563 & 2,016 \\ \hline Digital assets, net & & 184 & 1,260 \\ \hline Intangible assets, net & & 215 & 257 \\ \hline Goodwill & & 194 & 200 \\ \hline Other non-current assets & & 4,193 & 2,138 \\ \hline Total assets & & $82,338 & $62,131 \\ \hline \multicolumn{4}{|l|}{ Current liabilities } \\ \hline Accounts payable & & 15,255 & 10,025 \\ \hline Accrued liabilities and other & & 7,142 & 5,719 \\ \hline Deferred revenue & & 1,747 & 1,447 \\ \hline Customer deposits & & 1,063 & 925 \\ \hline Current portion of debt and finance leases & & 1,502 & 1,589 \\ \hline Total current liabilities & & 26,709 & 19,705 \\ \hline Debt and finance leases, net of current portion & & 1,597 & 5,245 \\ \hline Deferred revenue, net of current portion & & 2,804 & 2,052 \\ \hline Other long-term liabilities & & 5,330 & 3,546 \\ \hline Total liabilities & & 36,440 & 30,548 \\ \hline \multicolumn{4}{|l|}{ Commitments and contingencies (Note 15) } \\ \hline Redeemable noncontrolling interests in subsidiaries & & 409 & 568 \\ \hline \multicolumn{4}{|l|}{ Stockholders' equity } \\ \hline Commonstock;$0.001parvalue;6,000sharesauthorized;3,164and3,100sharoutstandingasofDecember31,2022andDecember31,2021,respectively(1) & (1) & 3 & 3 \\ \hline Additional paid-in capital & & 32,177 & 29,803 \\ \hline Accumulated other comprehensive (loss) income & & -361 & 54 \\ \hline Retained earnings ( 1 ) & (1) & 12,885 & 329 \\ \hline Total stockholders' equity & & 44,704 & 30,189 \\ \hline Noncontrolling interests in subsidiaries & & 785 & 826 \\ \hline Total liabilities and equity & & $82,338 & $62,131 \\ \hline \end{tabular} Access SEC. Gov for 10-Q (quarterly) and 10-K (annual) for filed financials \& analysis. Yahoo Finance an easy source as well - feel free for this easily accessible web source Begin by filling in all green shaded rows for Revenue through Operating Income. Next refer to Balance Sheet and fill in green shaded Total Assets and Shareholder Equity. Use this inserted financial data to compute \%'s in \#1 and \#2. If "N/A", do nothing. Note: "YTD Compared to LY YTD" refers to most recent 10-Q Financial Reports. Review the trends of the historical \%'s to forecast this full fiscal year's two \%'s in A \& B. For each forecast \%, explain why your forecast % is better or worse compared to prior year \%'s, based on your opinion of Morningstar's (or other source) "Stock Analysis" tab. Feel free to research online what others are forecasting and why, but keep track of any sources you find to use this research later this semester. Consolidated Statements of Cash Flows $ in Millions Cash Flows from Operating Activities Net income Adjustments to reconcile net income to net cash provided by operating activities: Depreciation, amortization and impairment Stock-based compensation Inventory and purchase commitments write-downs Foreign currency transaction net unrealized loss (gain) Non-cash interest and other operating activities Digital assets loss (gain), net Changes in operating assets and liabilities: Accounts receivable Inventory Operating lease vehicles Prepaid expenses and other current assets Other non-current assets Accounts payable and accrued liabilities Deferred revenue Customer deposits Other long-term liabilities Net cash provided by operating activities Cash Flows from Investing Activities Purchases of property and equipment excluding finance leases, net of sales Purchases of solar energy systems, net of sales Purchases of digital assets Proceeds from sales of digital assets Purchase of intangible assets Purchases of investments Proceeds from maturities of investments Receipt of government grants Business combinations, net of cash acquired Net cash used in investing activities Cash Flows from Financing Activities Proceeds from issuances of common stock in public offerings, net of issuance costs Proceeds from issuances of debt Repayments of convertible and other debt Collateralized lease repayments Proceeds from exercises of stock options and other stock issuances Principal payments on finance leases Debt issuance costs Proceeds from investments by noncontrolling interests in subsidiaries Distributions paid to noncontrolling interests in subsidiaries Payments for buy-outs of noncontrolling interests in subsidiaries Net cash (used in) provided by financing activities Effect of exchange rate changes on cash and cash equivalents and restricted cash Net (decrease) increase in cash and cash equivalents and restricted cash Cash and cash equivalents and restricted cash, beginning of period Cash and cash equivalents and restricted cash, end of period 12 Months Ended Dec. 31, 2022 Dec. 31, 2021 Dec. 31, 2020 $12,587 $5,644 $862 3,747 2,911 1,560 2,121 2,322 177 81 140 1,734 202 114 340 55 140 27 525 0 1,124 130 6,465 1,709 652 1,570 2,114 422 1,072 1,417 271 251 1,291 344 2,551 4,578 2,102 \begin{tabular}{ccc} 6,029 & 4,578 & 2,102 \\ 1,131 & 793 & 321 \\ 155 & 186 & 7 \\ 1,904 & 476 & 495 \\ \hline 14,724 & 11,497 & 5,943 \\ \hline7,158 & 6,482 & 3,157 \\ -5 & -32 & -75 \\ 0 & 1,500 & 0 \\ 936 & 272 & 0 \\ -9 & 0 & -10 \\ 5,835 & -132 & 0 \\ 22 & 0 & 0 \\ 76 & 6 & 123 \\ 0 & 0 & -13 \\ \hline11,973 & 7,868 & 3,132 \\ \hline \end{tabular} \begin{tabular}{ccc} \hline 0 & 0 & 12,269 \\ 0 & 8,883 & 9,713 \\ 3,364 & 14,167 & 11,623 \\ 0 & -9 & -240 \\ 541 & 707 & 417 \\ -502 & -439 & -338 \\ 0 & -9 & -6 \\ 0 & 2 & 24 \\ -157 & -161 & -208 \\ -45 & -10 & -35 \\ \hline3,527 & 5,203 & 9,973 \\ \hline-444 & -183 & 334 \\ \hline1,220 & 1,757 & 13,118 \\ \hline 18,144 & 19,901 & 6,783 \\ 16,924 & 18,144 & 19,901 \\ \hline \end{tabular} \begin{tabular}{|c|c|c|c|} \hline \multirow{2}{*}{ConsolidatedStatementsofOperations$inMillions} & \multicolumn{3}{|c|}{12 Months Ended } \\ \hline & Dec. 31, 2022 & Dec. 31, 2021 & Dec. 31, 2020 \\ \hline \multicolumn{4}{|l|}{ Revenues } \\ \hline Total revenues & $81,462 & $53,823 & $31,536 \\ \hline \multicolumn{4}{|l|}{ Cost of revenues } \\ \hline Total cost of revenues & 60,609 & 40,217 & 24,906 \\ \hline Gross profit & 20,853 & 13,606 & 6,630 \\ \hline \multicolumn{4}{|l|}{ Operating expenses } \\ \hline Research and development & 3,075 & 2,593 & 1,491 \\ \hline Selling, general and administrative & 3,946 & 4,517 & 3,145 \\ \hline Restructuring and other & 176 & -27 & 0 \\ \hline Total operating expenses & 7,197 & 7,083 & 4,636 \\ \hline Income from operations & 13,656 & 6,523 & 1,994 \\ \hline Interest income & 297 & 56 & 30 \\ \hline Interest expense & -191 & -371 & -748 \\ \hline Other (expense) income, net & -43 & 135 & -122 \\ \hline Income before income taxes & 13,719 & 6,343 & 1,154 \\ \hline Provision for income taxes & 1,132 & 699 & 292 \\ \hline Net income & 12,587 & 5,644 & 862 \\ \hline Netincomeattributabletononcontrollinginterestsandredeemablenoncontrollinginterestsinsubsidiaries & 31 & 125 & 141 \\ \hline Net income attributable to common stockholders & $12,556 & $5,519 & $721 \\ \hline \multicolumn{4}{|l|}{ Net income per share of common stock attributable to common stockholders } \\ \hline Basic & $4.02 & $1.87 & $0.25 \\ \hline Diluted & $3.62 & $1.63 & $0.21 \\ \hline \multicolumn{4}{|l|}{ Weighted average shares used in computing net income per share of common stock } \\ \hline Basic & 3,130 & 2,959 & 2,798 \\ \hline Diluted & 3,475 & 3,386 & 3,249 \\ \hline \end{tabular} \begin{tabular}{|c|c|c|c|} \hline \multicolumn{2}{|l|}{ConsolidatedBalanceSheets$inMillions} & Dec. 31, 2022 & Dec. 31, 2021 \\ \hline \multicolumn{4}{|l|}{ Current assets } \\ \hline Cash and cash equivalents & & $16,253 & $17,576 \\ \hline Short-term investments & & 5,932 & 131 \\ \hline Accounts receivable, net & & 2,952 & 1,913 \\ \hline Inventory & & 12,839 & 5,757 \\ \hline Prepaid expenses and other current assets & & 2,941 & 1,723 \\ \hline Total current assets & & 40,917 & 27,100 \\ \hline Property, plant and equipment, net & & 23,548 & 18,884 \\ \hline Operating lease right-of-use assets & & 2,563 & 2,016 \\ \hline Digital assets, net & & 184 & 1,260 \\ \hline Intangible assets, net & & 215 & 257 \\ \hline Goodwill & & 194 & 200 \\ \hline Other non-current assets & & 4,193 & 2,138 \\ \hline Total assets & & $82,338 & $62,131 \\ \hline \multicolumn{4}{|l|}{ Current liabilities } \\ \hline Accounts payable & & 15,255 & 10,025 \\ \hline Accrued liabilities and other & & 7,142 & 5,719 \\ \hline Deferred revenue & & 1,747 & 1,447 \\ \hline Customer deposits & & 1,063 & 925 \\ \hline Current portion of debt and finance leases & & 1,502 & 1,589 \\ \hline Total current liabilities & & 26,709 & 19,705 \\ \hline Debt and finance leases, net of current portion & & 1,597 & 5,245 \\ \hline Deferred revenue, net of current portion & & 2,804 & 2,052 \\ \hline Other long-term liabilities & & 5,330 & 3,546 \\ \hline Total liabilities & & 36,440 & 30,548 \\ \hline \multicolumn{4}{|l|}{ Commitments and contingencies (Note 15) } \\ \hline Redeemable noncontrolling interests in subsidiaries & & 409 & 568 \\ \hline \multicolumn{4}{|l|}{ Stockholders' equity } \\ \hline Commonstock;$0.001parvalue;6,000sharesauthorized;3,164and3,100sharoutstandingasofDecember31,2022andDecember31,2021,respectively(1) & (1) & 3 & 3 \\ \hline Additional paid-in capital & & 32,177 & 29,803 \\ \hline Accumulated other comprehensive (loss) income & & -361 & 54 \\ \hline Retained earnings ( 1 ) & (1) & 12,885 & 329 \\ \hline Total stockholders' equity & & 44,704 & 30,189 \\ \hline Noncontrolling interests in subsidiaries & & 785 & 826 \\ \hline Total liabilities and equity & & $82,338 & $62,131 \\ \hline \end{tabular} Access SEC. Gov for 10-Q (quarterly) and 10-K (annual) for filed financials \& analysis. Yahoo Finance an easy source as well - feel free for this easily accessible web source Begin by filling in all green shaded rows for Revenue through Operating Income. Next refer to Balance Sheet and fill in green shaded Total Assets and Shareholder Equity. Use this inserted financial data to compute \%'s in \#1 and \#2. If "N/A", do nothing. Note: "YTD Compared to LY YTD" refers to most recent 10-Q Financial Reports. Review the trends of the historical \%'s to forecast this full fiscal year's two \%'s in A \& B. For each forecast \%, explain why your forecast % is better or worse compared to prior year \%'s, based on your opinion of Morningstar's (or other source) "Stock Analysis" tab. Feel free to research online what others are forecasting and why, but keep track of any sources you find to use this research later this semester. Consolidated Statements of Cash Flows $ in Millions Cash Flows from Operating Activities Net income Adjustments to reconcile net income to net cash provided by operating activities: Depreciation, amortization and impairment Stock-based compensation Inventory and purchase commitments write-downs Foreign currency transaction net unrealized loss (gain) Non-cash interest and other operating activities Digital assets loss (gain), net Changes in operating assets and liabilities: Accounts receivable Inventory Operating lease vehicles Prepaid expenses and other current assets Other non-current assets Accounts payable and accrued liabilities Deferred revenue Customer deposits Other long-term liabilities Net cash provided by operating activities Cash Flows from Investing Activities Purchases of property and equipment excluding finance leases, net of sales Purchases of solar energy systems, net of sales Purchases of digital assets Proceeds from sales of digital assets Purchase of intangible assets Purchases of investments Proceeds from maturities of investments Receipt of government grants Business combinations, net of cash acquired Net cash used in investing activities Cash Flows from Financing Activities Proceeds from issuances of common stock in public offerings, net of issuance costs Proceeds from issuances of debt Repayments of convertible and other debt Collateralized lease repayments Proceeds from exercises of stock options and other stock issuances Principal payments on finance leases Debt issuance costs Proceeds from investments by noncontrolling interests in subsidiaries Distributions paid to noncontrolling interests in subsidiaries Payments for buy-outs of noncontrolling interests in subsidiaries Net cash (used in) provided by financing activities Effect of exchange rate changes on cash and cash equivalents and restricted cash Net (decrease) increase in cash and cash equivalents and restricted cash Cash and cash equivalents and restricted cash, beginning of period Cash and cash equivalents and restricted cash, end of period 12 Months Ended Dec. 31, 2022 Dec. 31, 2021 Dec. 31, 2020 $12,587 $5,644 $862 3,747 2,911 1,560 2,121 2,322 177 81 140 1,734 202 114 340 55 140 27 525 0 1,124 130 6,465 1,709 652 1,570 2,114 422 1,072 1,417 271 251 1,291 344 2,551 4,578 2,102 \begin{tabular}{ccc} 6,029 & 4,578 & 2,102 \\ 1,131 & 793 & 321 \\ 155 & 186 & 7 \\ 1,904 & 476 & 495 \\ \hline 14,724 & 11,497 & 5,943 \\ \hline7,158 & 6,482 & 3,157 \\ -5 & -32 & -75 \\ 0 & 1,500 & 0 \\ 936 & 272 & 0 \\ -9 & 0 & -10 \\ 5,835 & -132 & 0 \\ 22 & 0 & 0 \\ 76 & 6 & 123 \\ 0 & 0 & -13 \\ \hline11,973 & 7,868 & 3,132 \\ \hline \end{tabular} \begin{tabular}{ccc} \hline 0 & 0 & 12,269 \\ 0 & 8,883 & 9,713 \\ 3,364 & 14,167 & 11,623 \\ 0 & -9 & -240 \\ 541 & 707 & 417 \\ -502 & -439 & -338 \\ 0 & -9 & -6 \\ 0 & 2 & 24 \\ -157 & -161 & -208 \\ -45 & -10 & -35 \\ \hline3,527 & 5,203 & 9,973 \\ \hline-444 & -183 & 334 \\ \hline1,220 & 1,757 & 13,118 \\ \hline 18,144 & 19,901 & 6,783 \\ 16,924 & 18,144 & 19,901 \\ \hline \end{tabular} \begin{tabular}{|c|c|c|c|} \hline \multirow{2}{*}{ConsolidatedStatementsofOperations$inMillions} & \multicolumn{3}{|c|}{12 Months Ended } \\ \hline & Dec. 31, 2022 & Dec. 31, 2021 & Dec. 31, 2020 \\ \hline \multicolumn{4}{|l|}{ Revenues } \\ \hline Total revenues & $81,462 & $53,823 & $31,536 \\ \hline \multicolumn{4}{|l|}{ Cost of revenues } \\ \hline Total cost of revenues & 60,609 & 40,217 & 24,906 \\ \hline Gross profit & 20,853 & 13,606 & 6,630 \\ \hline \multicolumn{4}{|l|}{ Operating expenses } \\ \hline Research and development & 3,075 & 2,593 & 1,491 \\ \hline Selling, general and administrative & 3,946 & 4,517 & 3,145 \\ \hline Restructuring and other & 176 & -27 & 0 \\ \hline Total operating expenses & 7,197 & 7,083 & 4,636 \\ \hline Income from operations & 13,656 & 6,523 & 1,994 \\ \hline Interest income & 297 & 56 & 30 \\ \hline Interest expense & -191 & -371 & -748 \\ \hline Other (expense) income, net & -43 & 135 & -122 \\ \hline Income before income taxes & 13,719 & 6,343 & 1,154 \\ \hline Provision for income taxes & 1,132 & 699 & 292 \\ \hline Net income & 12,587 & 5,644 & 862 \\ \hline Netincomeattributabletononcontrollinginterestsandredeemablenoncontrollinginterestsinsubsidiaries & 31 & 125 & 141 \\ \hline Net income attributable to common stockholders & $12,556 & $5,519 & $721 \\ \hline \multicolumn{4}{|l|}{ Net income per share of common stock attributable to common stockholders } \\ \hline Basic & $4.02 & $1.87 & $0.25 \\ \hline Diluted & $3.62 & $1.63 & $0.21 \\ \hline \multicolumn{4}{|l|}{ Weighted average shares used in computing net income per share of common stock } \\ \hline Basic & 3,130 & 2,959 & 2,798 \\ \hline Diluted & 3,475 & 3,386 & 3,249 \\ \hline \end{tabular}
Step by Step Solution
There are 3 Steps involved in it

Get step-by-step solutions from verified subject matter experts