

Question: I need help filling this table with this data attached below. + Sheen Pooled class data for tree dbh and basal area data Note: Basal
I need help filling this table with this data attached below.
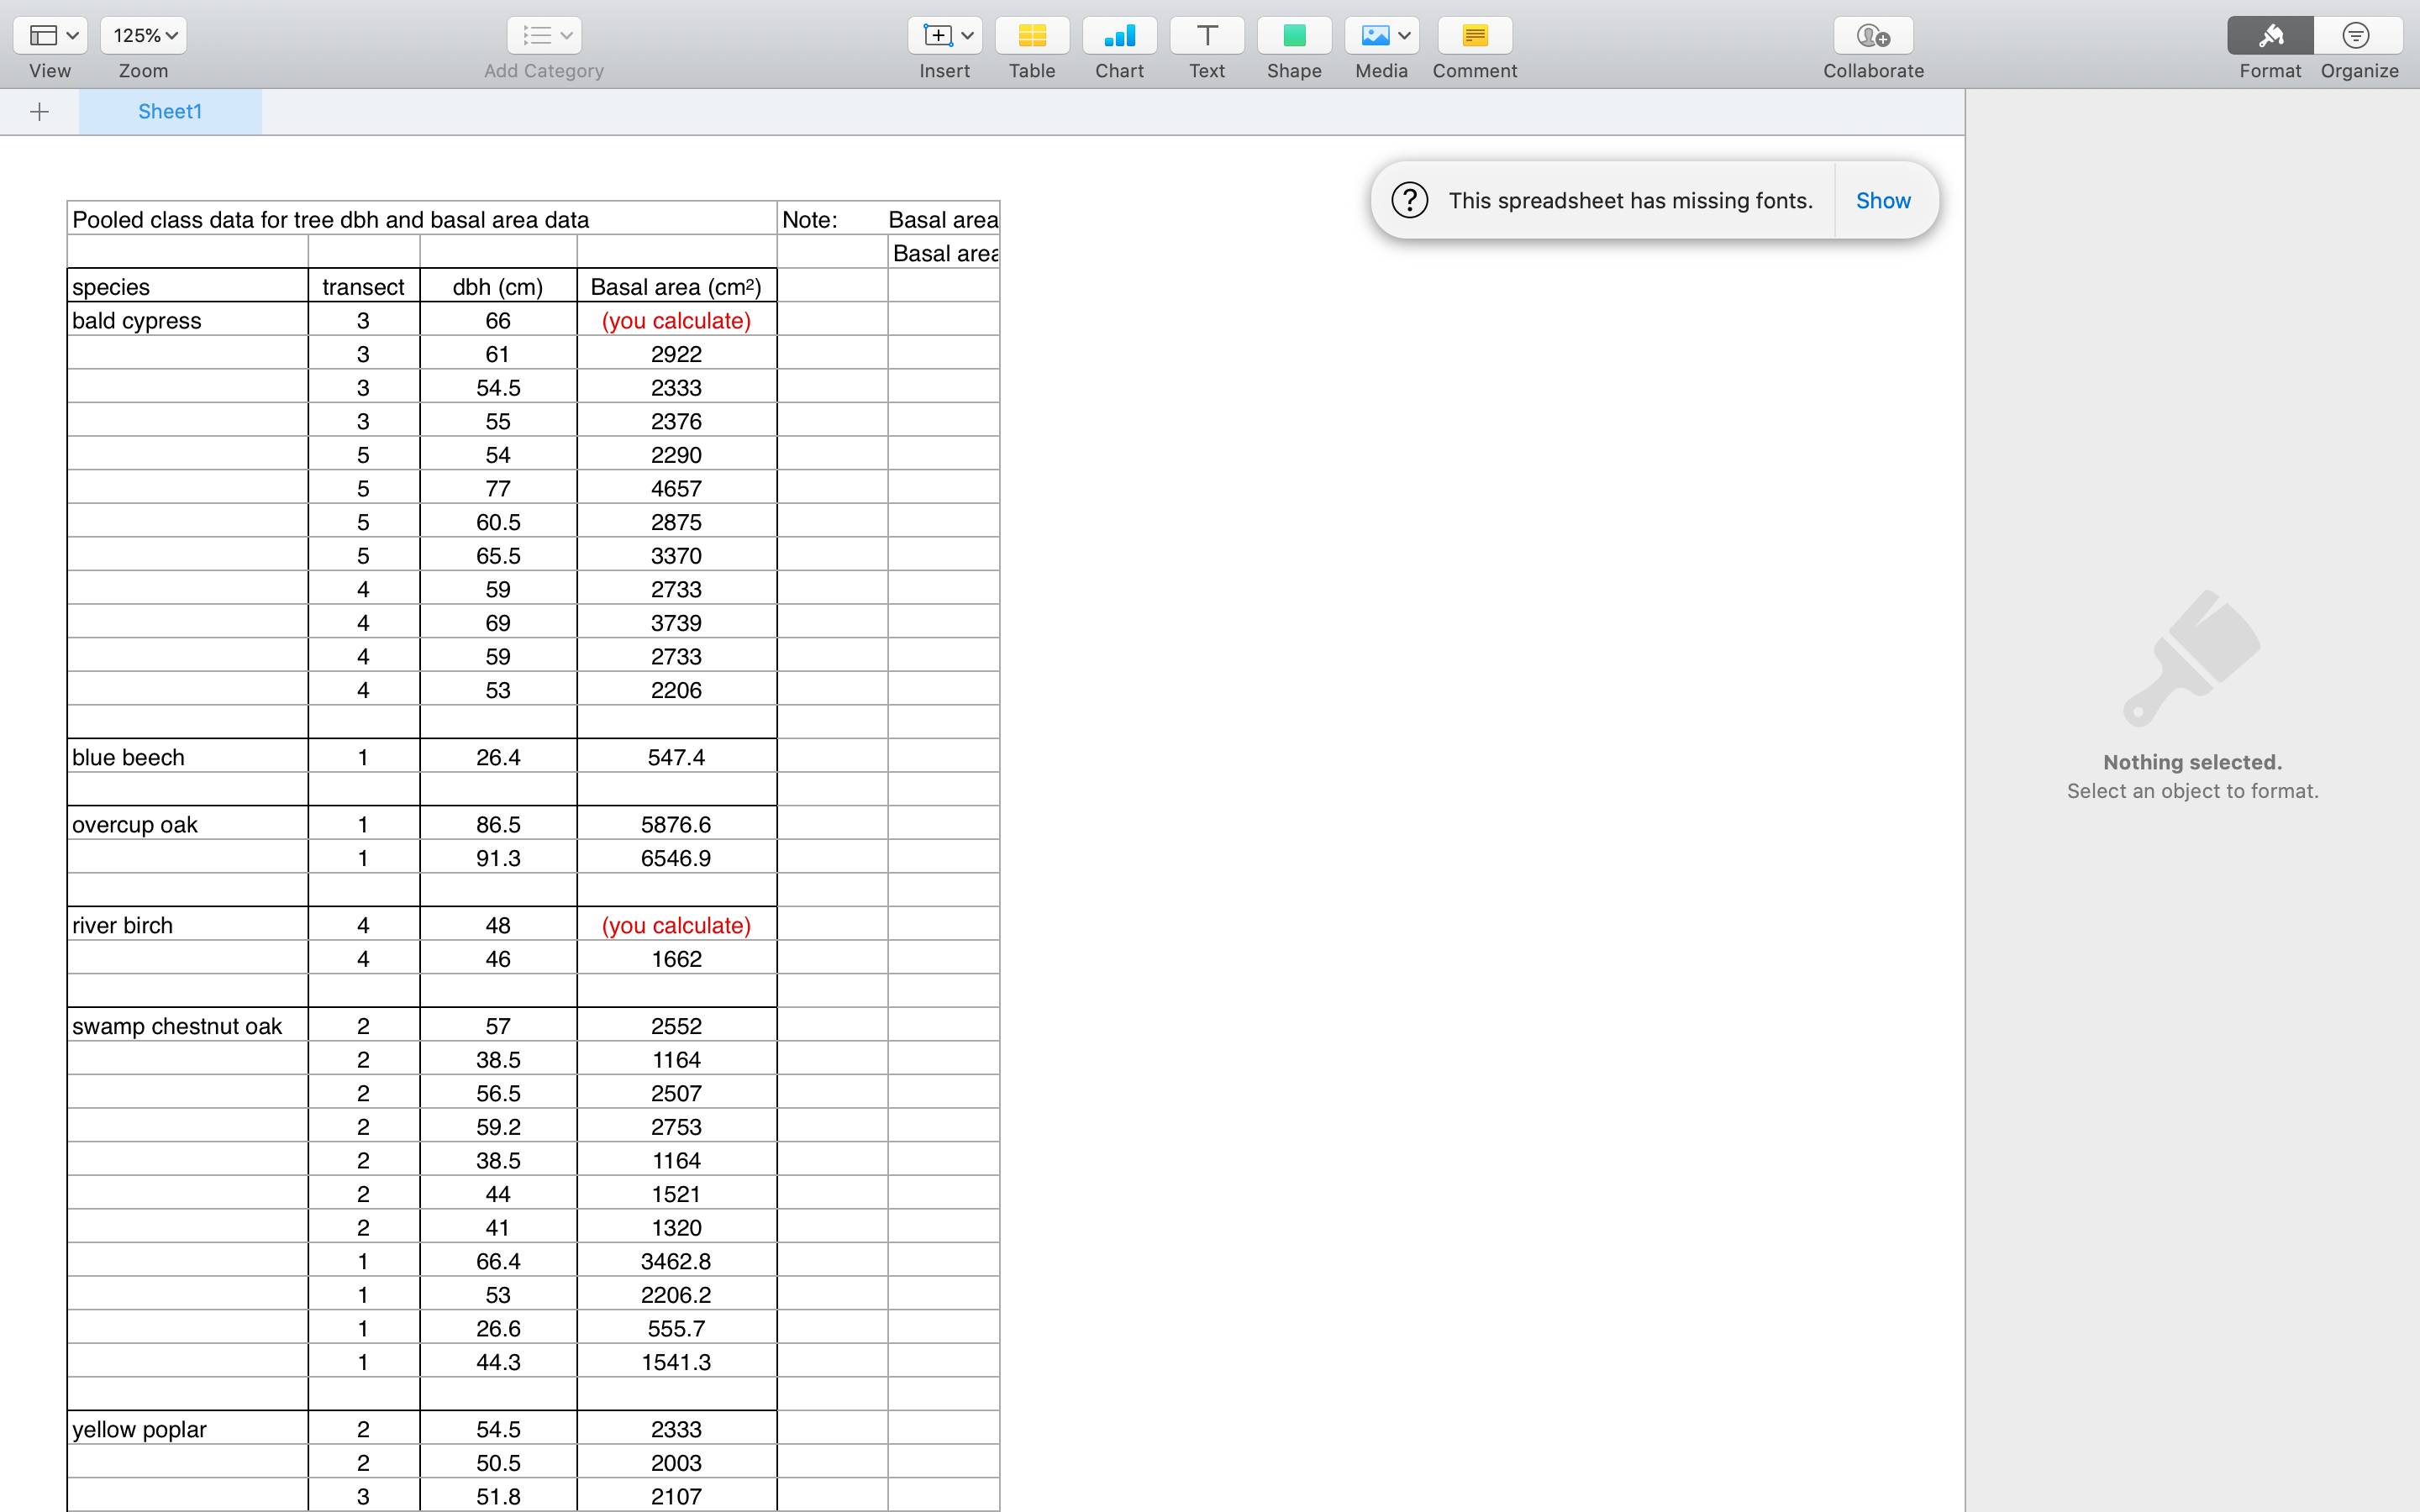
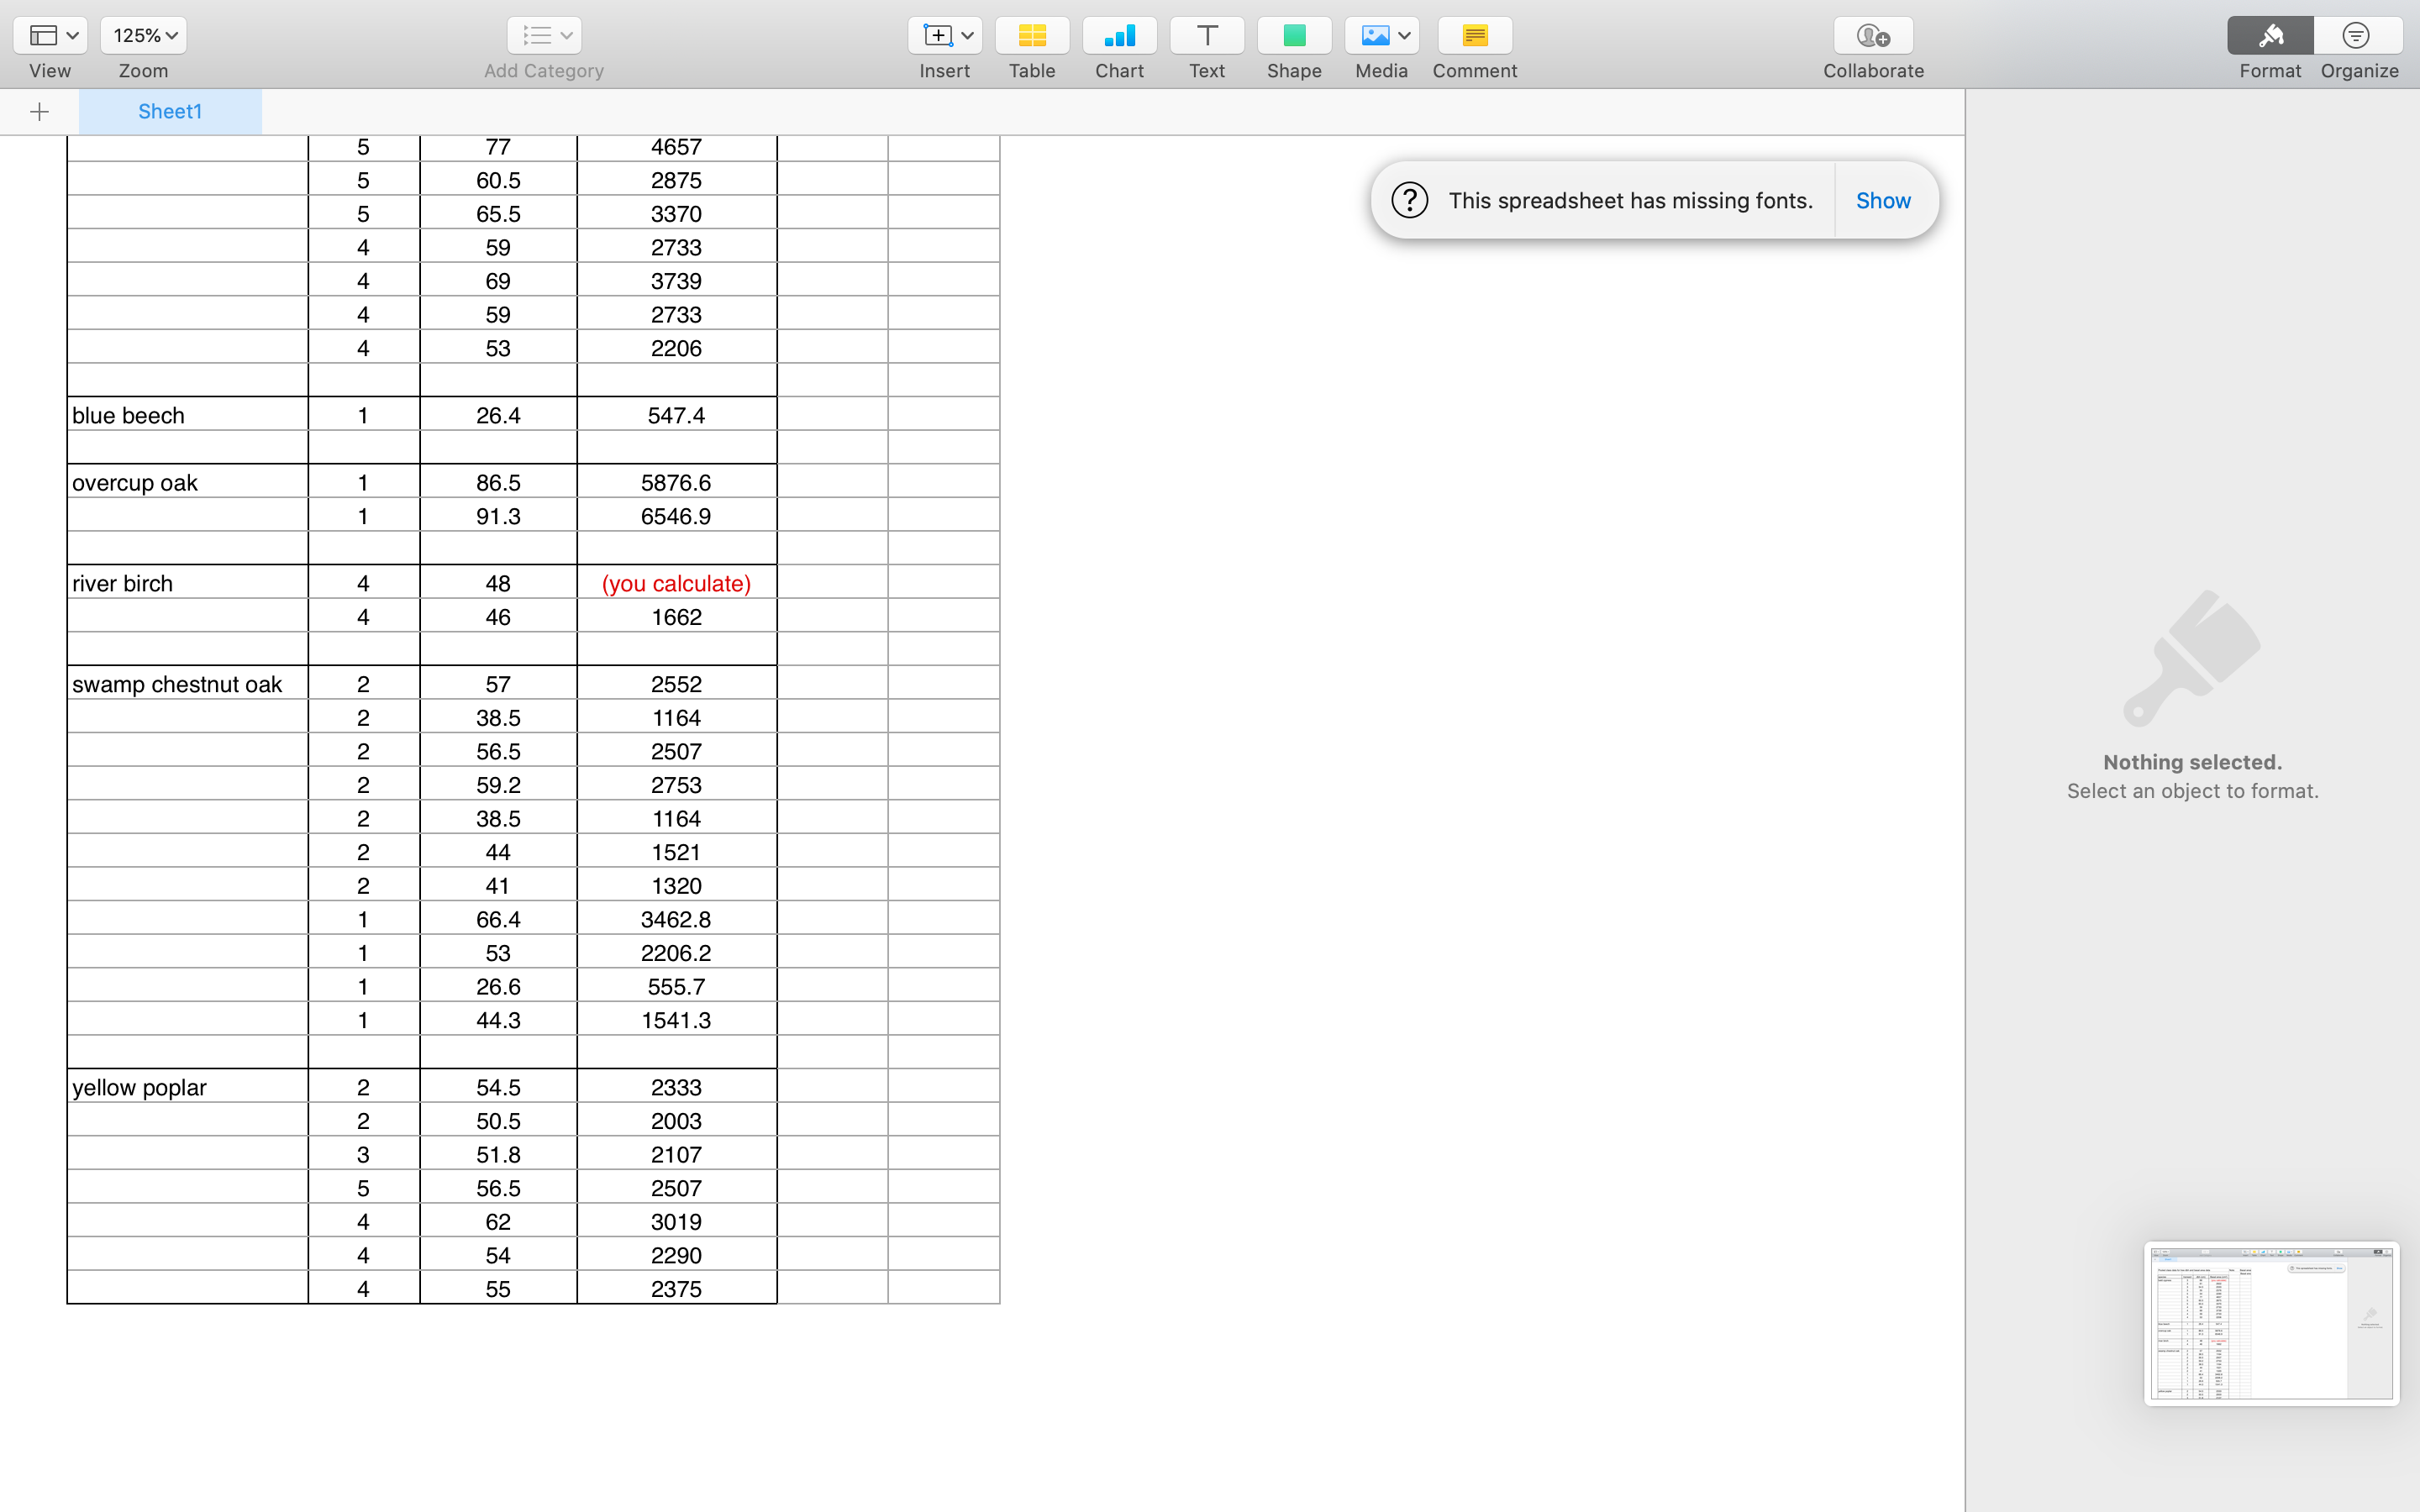
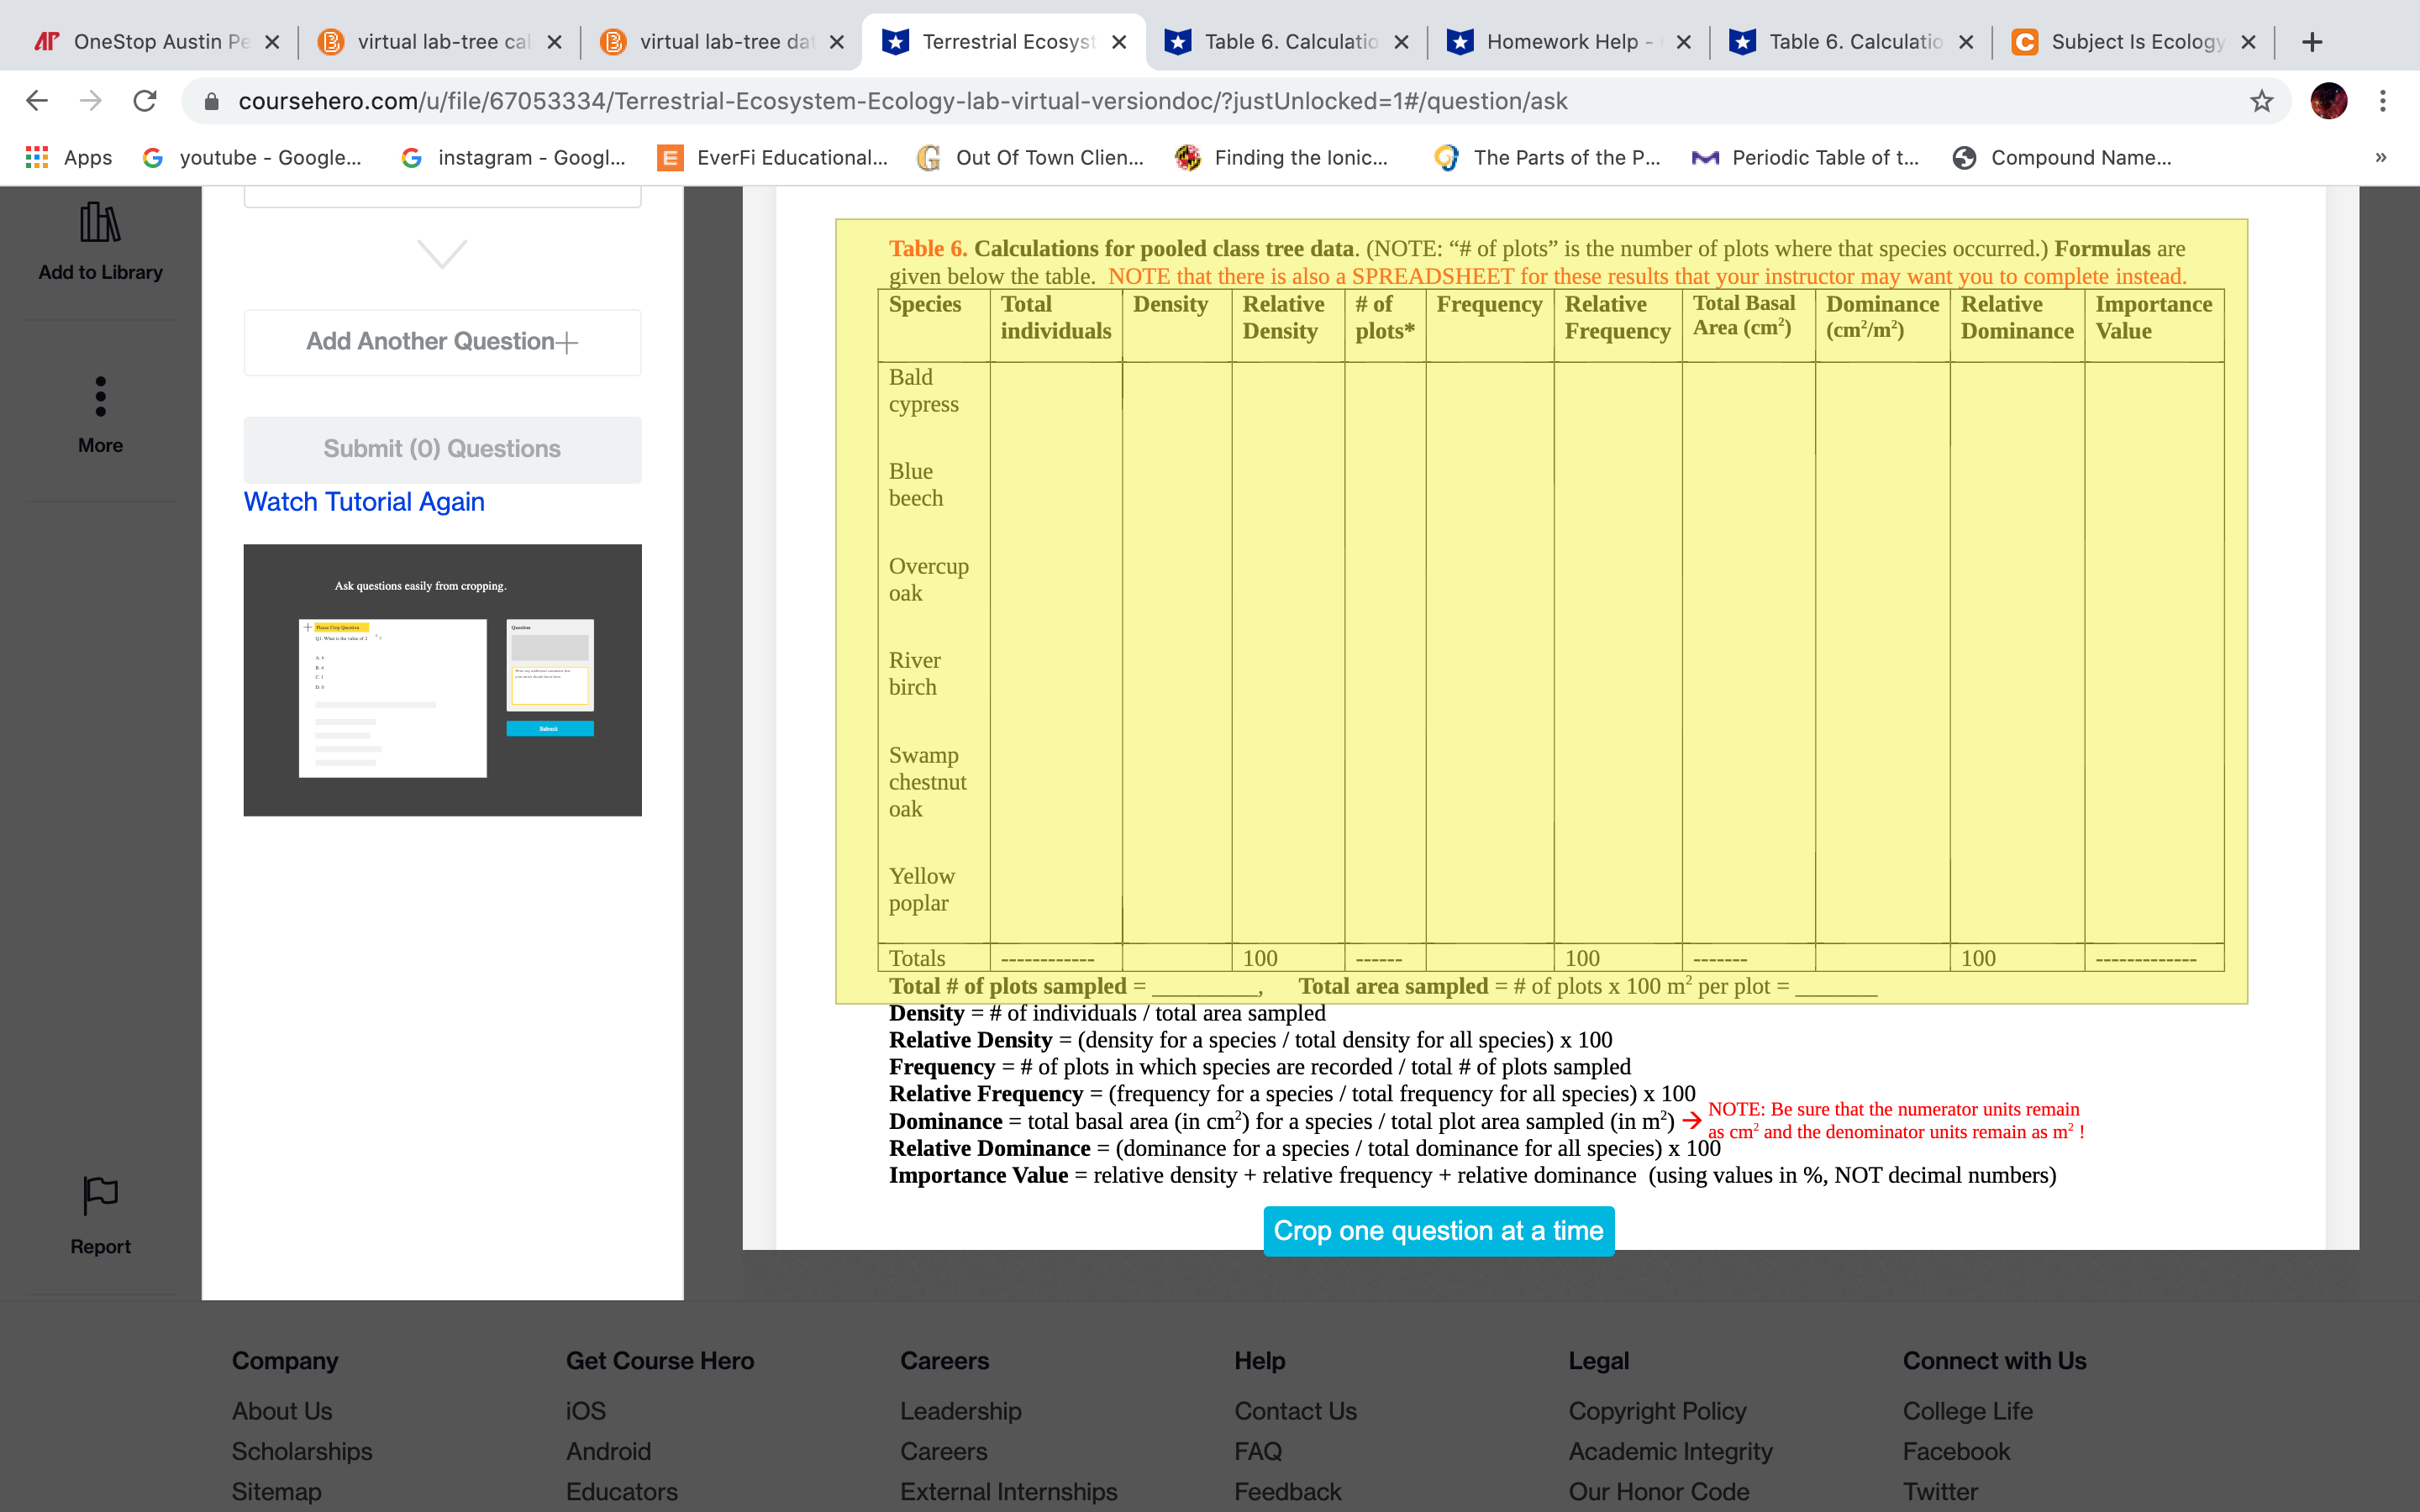
+ Sheen Pooled class data for tree dbh and basal area data Note: Basal area species Basal area (cm?) Basal area bald cypress {D (you calculate) 2922 2333 2376 2290 4657 2875 3370 2733 3739 2733 ###&UIOIUIUIQWW 2206 blue beech 547.4 overcup oak 5876.6 6546.9 river birch 4 48 (you calculate) 4 46 1 662 swamp chestnut oak 2 57 2552 2 38.5 11 64 2 56.5 2507 2 59.2 2753 2 38.5 11 64 2 44 1 521 2 41 1 320 1 66.4 3462.8 1 53 2206.2 1 26.6 555.7 1 44.3 1 541 .3 ellow poplar 2 54.5 2333 2 50.5 2003 3 51 .8 21 07 This spreadsheet has missing fon Show 2' Nothing selected. Select an object to format. 125% Ev [+ v T D V Format Organize View Zoom Add Category Insert Table Chart Text Shape Media Comment Collaborate + Sheet1 77 4657 60.5 2875 65.5 3370 (? This spreadsheet has missing fonts. Show 4 59 2733 4 69 3739 4 59 2733 A 53 2206 blue beech 1 26.4 547.4 overcup oak 1 86.5 5876.6 1 91.3 6546.9 river birch 4 48 (you calculate) 46 1662 swamp chestnut oak NN N 57 2552 38.5 1164 56.5 2507 Nothing selected. 2 59.2 2753 Select an object to format. 2 38.5 1164 44 1521 41 1320 1 66.4 3462.8 1 53 2206.2 1 26.6 655.7 1 44.3 1541.3 yellow poplar UI W N N 54.5 2333 50.5 2003 51.8 2107 56.5 2507 4 62 3019 4 54 2290 4 55 2375AP OneStop Austin Pe X @ virtual lab-tree cal X virtual lab-tree dat x *Terrestrial Ecosystemle 6. CalculationX Homework Help - X Table 6. CalculationX C Subject Is Ecology X + coursehero.com/u/file/67053334/Terrestrial-Ecosystem-Ecology-lab-virtual-versiondoc/?justUnlocked=1#/question/ask . . . Apps G youtube - Google... G instagram - Googl... |EverFi Educational... G Out Of Town Clien... Finding the lonic... The Parts of the P... M Periodic Table of t... Compound Name... Table 6. Calculations for pooled class tree data. (NOTE: "# of plots" is the number of plots where that species occurred.) Formulas are Add to Library given below the table. NOTE that there is also a SPREADSHEET for these results that your instructor may want you to complete instead. Species Total Density Relative # of Frequency |Relative Total Basal Dominance Relative Importance Add Another Question+ individuals Density plots* Frequency Area (cm-) (cm /m') Dominance . . Bald cypress More Submit (0) Questions Blue Watch Tutorial Again beech Overcup Ask questions easily from cropping. oak River birch Swamp chestnut oak Yellow poplar Totals 100 100 100 Total # of plots sampled = Total area sampled = # of plots x 100 m per plot = Density = # of individuals / total area sampled Relative Density = (density for a species / total density for all species) x 100 Frequency = # of plots in which species are recorded / total # of plots sampled Relative Frequency = (frequency for a species / total frequency for all species) x 100 Dominance = total basal area (in cm ) for a species / total plot area sampled (in m?) -> NOTE: Be sure that the numerator units remain Relative Dominance = (dominance for a species / total dominance for all species) x 100 as cm and the denominator units remain as m? ! Importance Value = relative density + relative frequency + relative dominance (using values in %, NOT decimal numbers) Report Crop one question at a time Company Get Course Hero Careers Help Legal Connect with Us About Us ios Leadership Contact Us Copyright Policy College Life Scholarships Android Careers FAQ Academic Integrity Facebook Sitemap Educators External Internships Feedback Our Honor Code Twitter
Step by Step Solution
There are 3 Steps involved in it

Get step-by-step solutions from verified subject matter experts