

Question: I need help finding the answer that I believe is the upper and lower bound. The accompanying data represent the total travel tax (in dollars)
I need help finding the answer that I believe is the upper and lower bound.
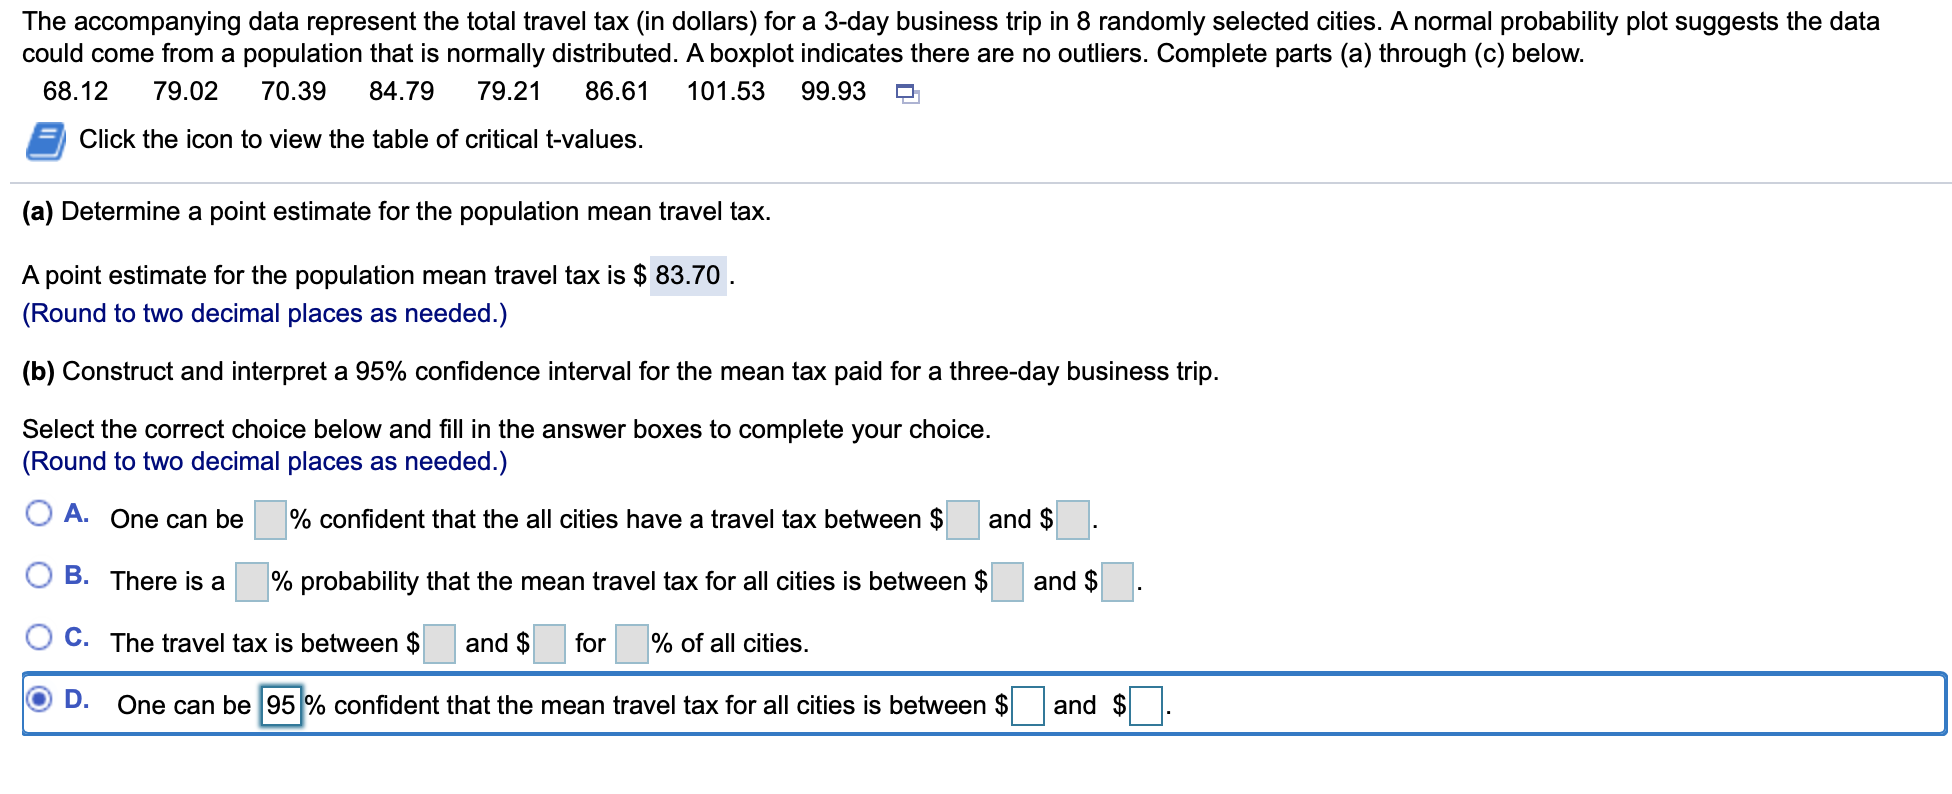
The accompanying data represent the total travel tax (in dollars) for a 3-day business trip in 8 randomly selected cities. A normal probability plot suggests the data could come from a population that is normally distributed. A boxplot indicates there are no outliers. Complete parts (a) through (c) below. 68.12 79.02 70.39 84.79 79.21 86.61 101.53 99.93 91 a Click the icon to view the table of critical t-values. (3) Determine a point estimate for the population mean travel tax. A point estimate for the population mean travel tax is $ 83.70 . (Round to two decimal places as needed.) (b) Construct and interpret a 95% condence interval for the mean tax paid for a three-day business trip. Select the correct choice below and ll in the answer boxes to complete your choice. (Round to two decimal places as needed.) 0 A- One can be D% condent that the all cities have a travel tax between $E| and $D. O 3- There is a % probability that the mean travel tax for all cities is between $| and $5 I. O C- The travel tax is between $D and $E| for D% of all cities. 9- One can be /o condent that the mean travel tax for all cities is between $D and $D
Step by Step Solution
There are 3 Steps involved in it

Get step-by-step solutions from verified subject matter experts