

Question: I need help finding the CPK and DPMO within Excel. For the following case (this case is the 2 problem of Assignment 7), Find Cp.
I need help finding the CPK and DPMO within Excel.
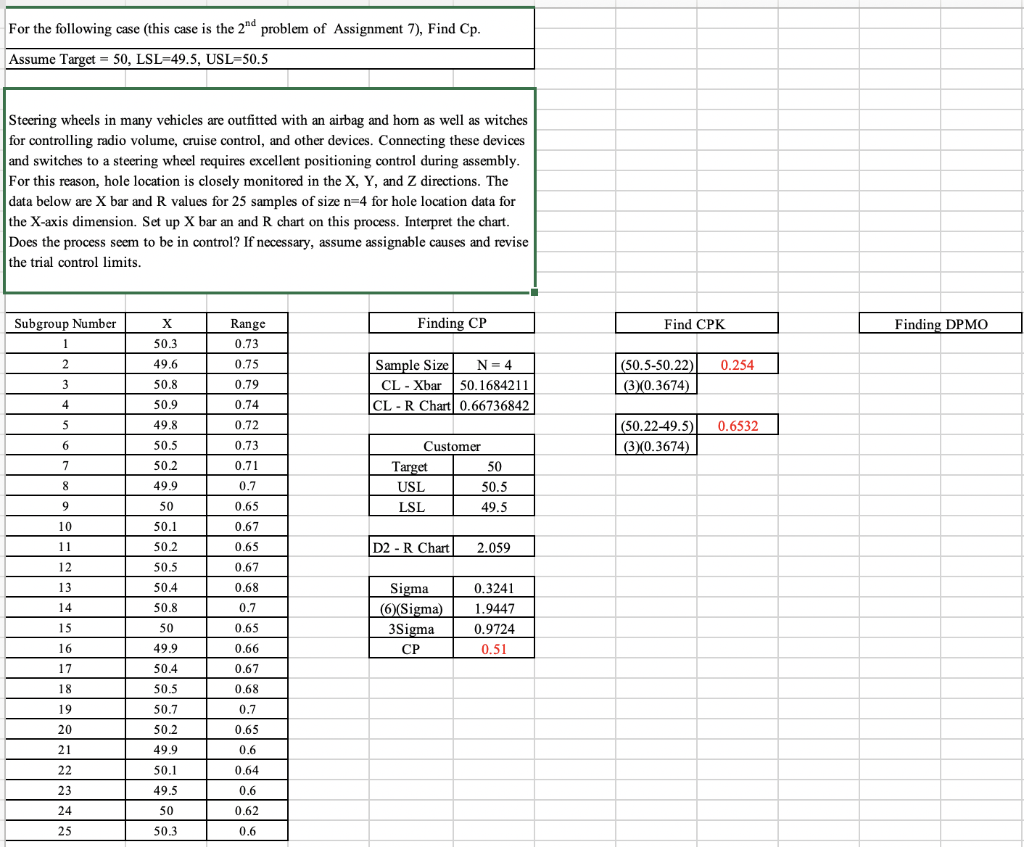
For the following case (this case is the 2" problem of Assignment 7), Find Cp. Assume Target = 50, LSL=49.5, USL=50.5 Steering wheels in many vehicles are outfitted with an airbag and hom as well as witches for controlling radio volume, cruise control, and other devices. Connecting these devices and switches to a steering wheel requires excellent positioning control during assembly. For this reason, hole location is closely monitored in the X, Y, and Z directions. The data below are X bar and R values for 25 samples of size n=4 for hole location data for the X-axis dimension. Set up X bar an and R chart on this process. Interpret the chart. Does the process seem to be in control? If necessary, assume assignable causes and revise the trial control limits. X Finding CP Find CPK Subgroup Number 1 Finding DPMO 50.3 Range 0.73 0.75 2 0.254 49.6 50.8 50.9 3 (50.5-50.22) (3X0.3674) Sample Size N=4 CL - Xbar 50.1684211 CL - R Chart 0.66736842 0.79 0.74 4 5 49.8 0.72 0.6532 (50.22-49.5) (3)(0.3674) 6 50.5 0.73 50.2 0.71 7 8 8 Customer Target 50 USL 50.5 LSL 49.5 49.9 0.7 9 50 0.65 0.67 10 50.1 11 0.65 D2-R Chart 2.059 12 0.67 13 50.2 50.5 50.4 50.8 50 0.68 0.7 14 Sigma (Sigma) 3Sigma CP 0.3241 1.9447 0.9724 0.51 15 0.65 16 0.66 17 18 49.9 50.4 50.5 0.67 0.68 19 50.7 0.7 20 50.2 0.65 0.6 21 49.9 0.64 22 23 50.1 49.5 0.6 0.62 24 50 25 50.3 0.6 For the following case (this case is the 2" problem of Assignment 7), Find Cp. Assume Target = 50, LSL=49.5, USL=50.5 Steering wheels in many vehicles are outfitted with an airbag and hom as well as witches for controlling radio volume, cruise control, and other devices. Connecting these devices and switches to a steering wheel requires excellent positioning control during assembly. For this reason, hole location is closely monitored in the X, Y, and Z directions. The data below are X bar and R values for 25 samples of size n=4 for hole location data for the X-axis dimension. Set up X bar an and R chart on this process. Interpret the chart. Does the process seem to be in control? If necessary, assume assignable causes and revise the trial control limits. X Finding CP Find CPK Subgroup Number 1 Finding DPMO 50.3 Range 0.73 0.75 2 0.254 49.6 50.8 50.9 3 (50.5-50.22) (3X0.3674) Sample Size N=4 CL - Xbar 50.1684211 CL - R Chart 0.66736842 0.79 0.74 4 5 49.8 0.72 0.6532 (50.22-49.5) (3)(0.3674) 6 50.5 0.73 50.2 0.71 7 8 8 Customer Target 50 USL 50.5 LSL 49.5 49.9 0.7 9 50 0.65 0.67 10 50.1 11 0.65 D2-R Chart 2.059 12 0.67 13 50.2 50.5 50.4 50.8 50 0.68 0.7 14 Sigma (Sigma) 3Sigma CP 0.3241 1.9447 0.9724 0.51 15 0.65 16 0.66 17 18 49.9 50.4 50.5 0.67 0.68 19 50.7 0.7 20 50.2 0.65 0.6 21 49.9 0.64 22 23 50.1 49.5 0.6 0.62 24 50 25 50.3 0.6Step by Step Solution
There are 3 Steps involved in it
1 Expert Approved Answer
Step: 1 Unlock

Question Has Been Solved by an Expert!
Get step-by-step solutions from verified subject matter experts
Step: 2 Unlock
Step: 3 Unlock