

Question: I need help finding the slope regression line for part 3 please. Vapor pressure measurements at several different temperatures are shown for mercury. Determine graphically
I need help finding the slope regression line for part 3 please.
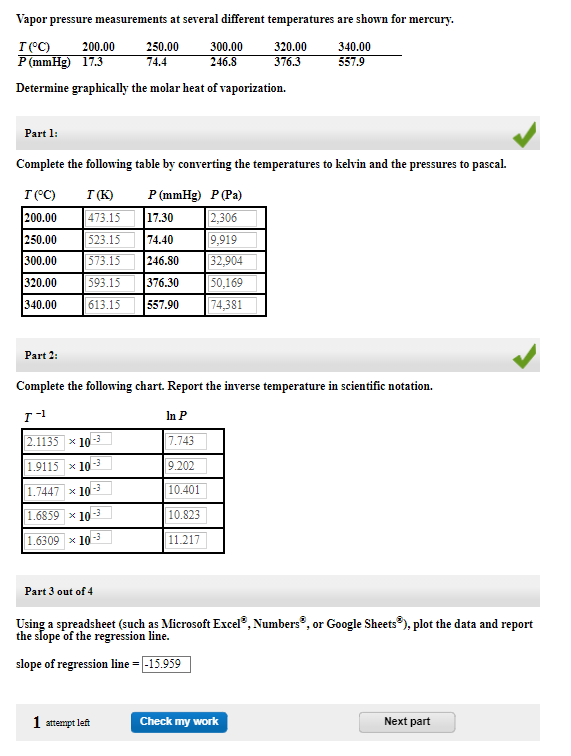
Vapor pressure measurements at several different temperatures are shown for mercury. Determine graphically the molar heat of vaporization. Part 1: Complete the following table by converting the temperatures to kelvin and the pressures to pascal. Part 2: Complete the following chart. Report the inverse temperature in scientific notation. Part 3 out of 4 Using a spreadsheet (such as Microsoft Excel 8, Numbers 8, or Google Sheets 8 ), plot the data and report the slope of the regression line. slope of regression line =
Step by Step Solution
There are 3 Steps involved in it
1 Expert Approved Answer
Step: 1 Unlock

Question Has Been Solved by an Expert!
Get step-by-step solutions from verified subject matter experts
Step: 2 Unlock
Step: 3 Unlock