

Question: I need help finding Vmax and Kmax. My graph is not coming out as intended and I'm not sure what to do. RUN 1 (note
I need help finding Vmax and Kmax. My graph is not coming out as intended and I'm not sure what to do.
![v(mmol/Lmin)=0.003268 [S]=0,714 mmol/L RUN 2 (note that in each case PNP +H2O=1.0mL](https://dsd5zvtm8ll6.cloudfront.net/si.experts.images/questions/2024/09/66f8f63cde728_99666f8f63cd8d70.jpg)
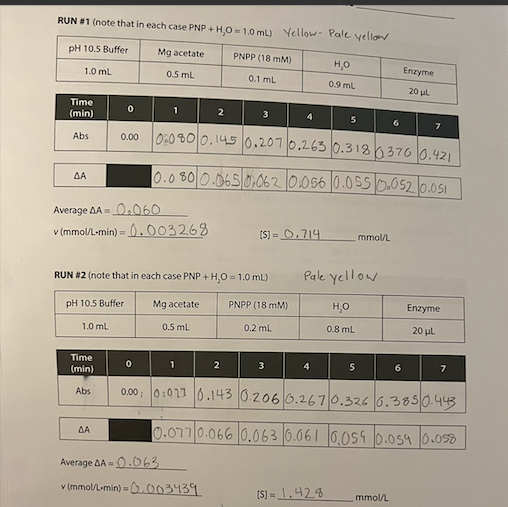
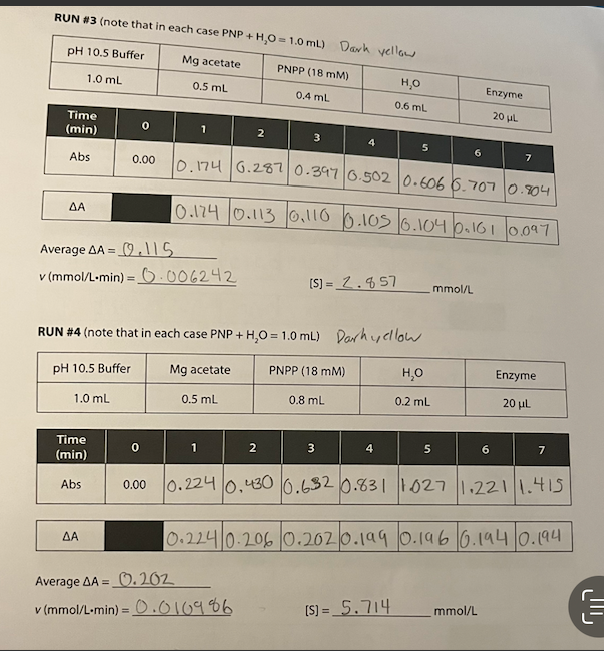
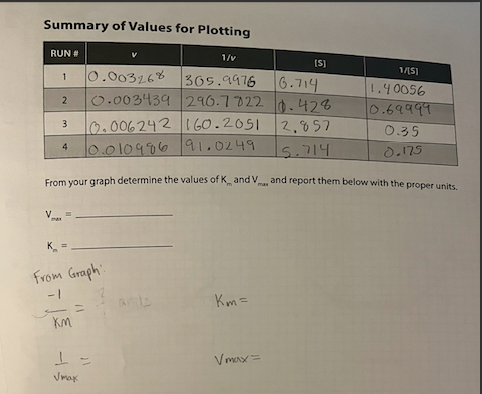
RUN 1 (note that in each case PNP +H2O=1.0mL ) Yellaw- Pale. Average A=0.060 v(mmol/Lmin)=0.003268 [S]=0,714 mmol/L RUN 2 (note that in each case PNP +H2O=1.0mL ) Pale yell YW Average A=0.063 v(mmol/mmin)=0.003439 [S]=1.428 Average A=0.115 v(mmol/Lmin)=0.006242 [S]=2.857mmol/L RUN \#4 (note that in each case PNP +H2O=1.0mL ) Dar hy cllow Average A=0.202 v(mmol/Lmin)=0.010986 [S]=5.714 mmol/L Summary of Values for Plotting From your graph determine the values of Km and Vmax and report them below with the proper units. Vmes=Kn= from Graphn
Step by Step Solution
There are 3 Steps involved in it

Get step-by-step solutions from verified subject matter experts