

Question: I need help finding Walmart's industry rations in column H and analyzing the data over the most recent two-year period by comparing it with industry
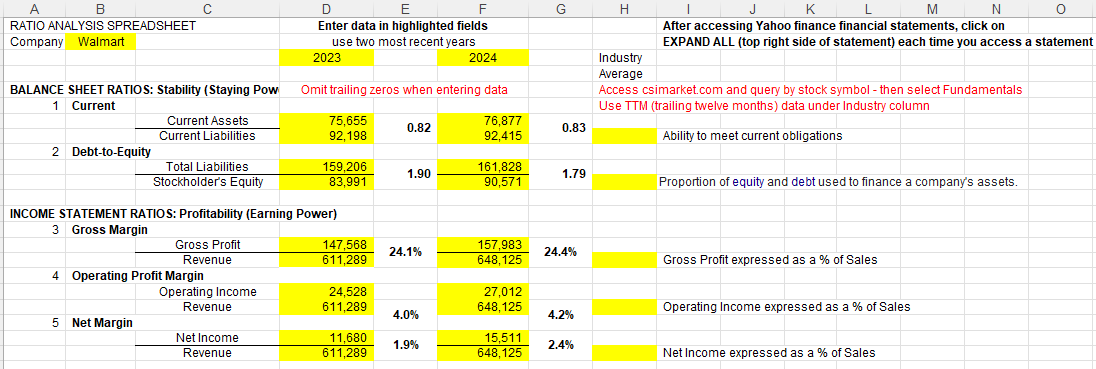
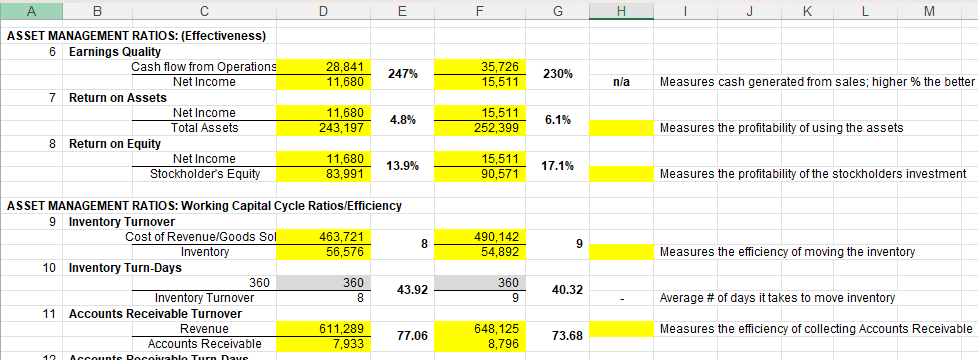
I need help finding Walmart's industry rations in column H and analyzing the data over the most recent two-year period by comparing it with industry averages in key areas such as staying power, earning power, overall efficiency ratios, and working capital cycle ratios. I am not good at reading numbers, so I am having a hard time with this assignment.
https://csimarket.com/stocks/fundamentals_glance.php?code=WMT
Step by Step Solution
There are 3 Steps involved in it
1 Expert Approved Answer
Step: 1 Unlock

Question Has Been Solved by an Expert!
Get step-by-step solutions from verified subject matter experts
Step: 2 Unlock
Step: 3 Unlock