

Question: I need help finishing and plotting the following graphs in excel. 1. Consider the following data on distances traveled by 100 people to visit the
I need help finishing and plotting the following graphs in excel.
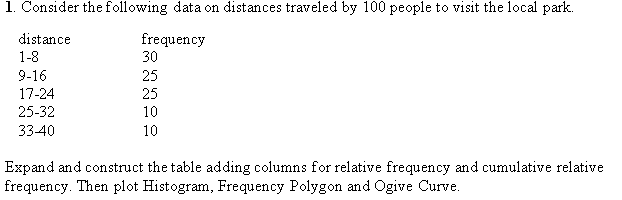
1. Consider the following data on distances traveled by 100 people to visit the local park. distance frequency 1-8 30 9-16 25 17-24 25 25-32 10 33-40 10 Expand and construct the table adding columns for relative frequency and cumulative relative frequency. Then plot Histogram, Frequency Polygon and Ogive Curve
Step by Step Solution
There are 3 Steps involved in it
1 Expert Approved Answer
Step: 1 Unlock

Question Has Been Solved by an Expert!
Get step-by-step solutions from verified subject matter experts
Step: 2 Unlock
Step: 3 Unlock