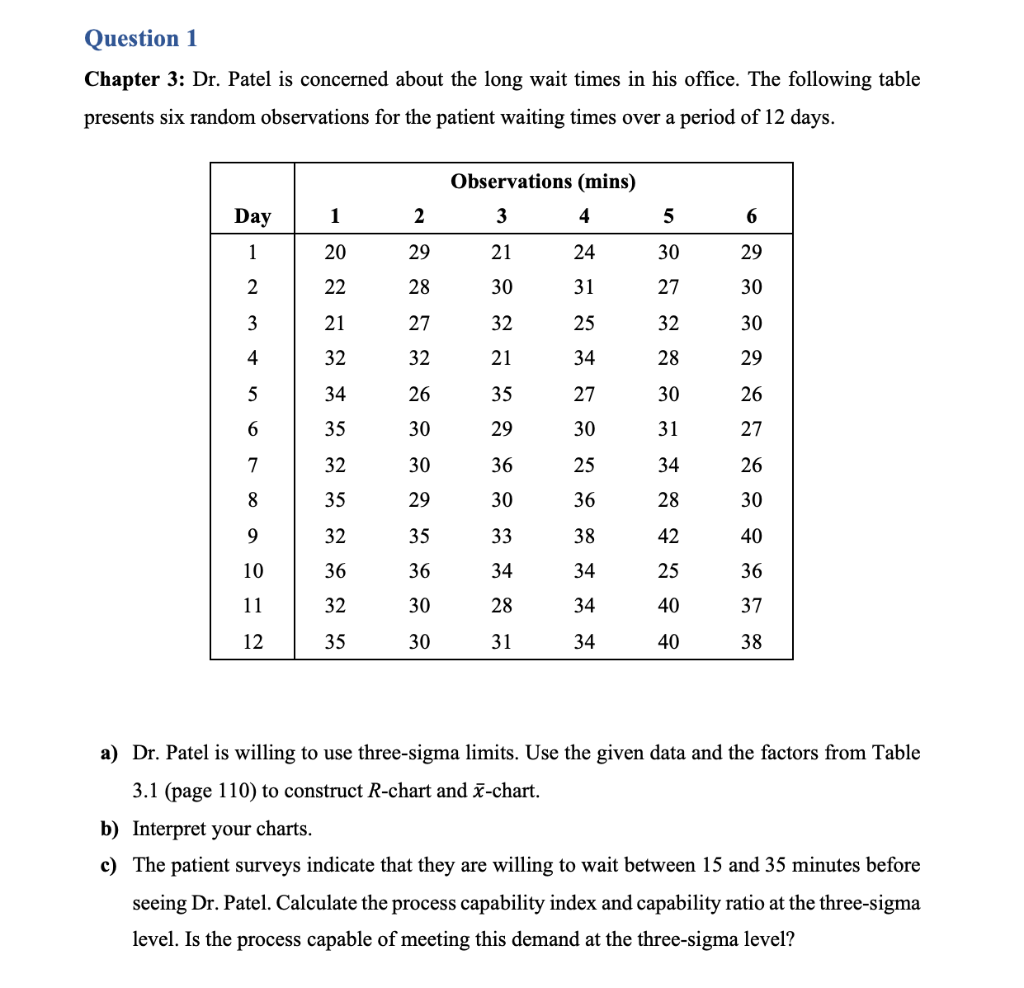
Question: I need help fixing my question. The professor marked what was wrong or missing, highlighted in red. Please help me fix it. Question 1 Chapter

I need help fixing my question. The professor marked what was wrong or missing, highlighted in red. Please help me fix it.

I need help fixing my question. The professor

I need help fixing my question. The professor

I need help fixing my question. The professor

Question 1 Chapter 3: Dr. Patel is concerned about the long wait times in his office. The following table presents six random observations for the patient waiting times over a period of 12 days. Observations (mins) Day 1 2 3 4 5 6 1 20 29 21 24 30 29 2 22 28 30 31 27 30 3 21 27 32 25 32 30 4 32 32 21 34 28 29 5 34 26 35 27 30 26 6 35 30 29 30 31 27 7 32 30 36 25 34 26 8 35 29 30 36 28 30 9 32 35 33 38 42 40 10 36 36 34 34 25 36 11 32 30 28 34 40 37 12 35 30 31 34 40 38 a) Dr. Patel is willing to use three-sigma limits. Use the given data and the factors from Table 3.1 (page 110) to construct R-chart and -chart. b) Interpret your charts. c) The patient surveys indicate that they are willing to wait between 15 and 35 minutes before seeing Dr. Patel. Calculate the process capability index and capability ratio at the three-sigma level. Is the process capable of meeting this demand at the three-sigma level? Question 1 a) X 28.0 25.5 28.0 27.8 29.3 29.6 30.3 30.5 31.3 36.6 33.5 33.5 34.6 0 3 3 7 3 O 3 7 0 0 7 Total bar 0 370. 83 Ran 10 11 13 11 8 10 11 12 10 Total ge 122. 00 The x double bar would equal to the sum of x bar values divided by the number of days 370.83 12 30.90 = The r bar would equal to the sum of all range values divided by the number of values 122 12 = 10.17 The control limits for the x from mean factor table (n) = 6, A2 = 0.483 LCL = x double bar - (r bar x a2) 30.90 - (10.17 x 0.483) = 35.81 UCL?? The control limits for r from mean factor table d3 = 0, d4 = 2.004 LCL = d3 x r bar 0 x 10.17 = 0 UCL R=d4 x r bar 2.004 x 10.17 = 20.38 How about x-bar and R charts? 2.004 x 10.17 = 20.38 How about x-bar and R charts? b) There are a lot of values which are outside of the control limits of the x bar and the r bar charts. Your file does not include your charts. Examples are days 1-4 and this can be interpreted that 2 the process is out of control. This interpretation indicates that the process is out of control. Which chart is your explanation for? You should provide an explanation for each chart. c) Crk=min (CRU. CRL) CpX = (USL - x double bar) divided by (3 x r bar divided by d2) (35 30.90) divide by (3 x 10.17 divided by 2.534) = 41.1/12.040 = 0.341 CPL = (x double bar - LSL) divided by (3 x r bar divided by d2) (30.90 15) divided by (3 x 10.17 divided by 2.534) = 15.9/12.040 = 1.321 Cpk= Min (0.341, 1.321) = 0.341 Process capability ratio Cp Cp = (USL - LSL) divided by (6 x r bar divided by d2) (35 15) divided by (6 x 10.17 divided by 2.534) = 20/24.081 = 0.831 The value of Crk and Cp are less than 1 meaning that the process won't be able to meet the demand under 3 sigma limits

Step by Step Solution

There are 3 Steps involved in it

1 Expert Approved Answer
Step: 1 Unlock blur-text-image
Question Has Been Solved by an Expert!

Get step-by-step solutions from verified subject matter experts

Step: 2 Unlock
Step: 3 Unlock

Students Have Also Explored These Related General Management Questions!