

Question: I need help going over the the two charts attached, If you were a manager having to review this two charts, looking at the data
I need help going over the the two charts attached, If you were a manager having to review this two charts, looking at the data I need help coming up with a conclusion from the information provided. What are your thought?
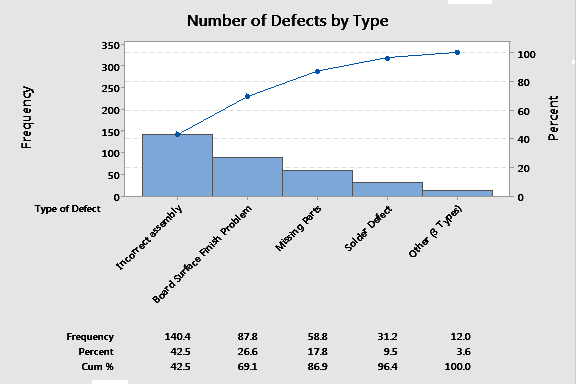
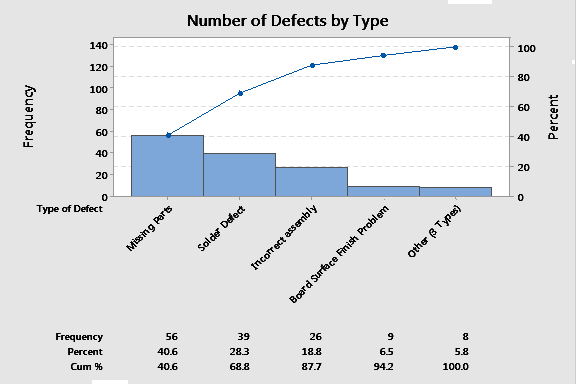
Number of Defects by Type 350 100 300 250 200 Frequency 60 Percent 150 40 100 50 20 Type of Defect parts oh Problem Solder Defect Incorrect assembly Other @ Type Missit Board Surface Fit Frequency 140.4 56.8 31.2 12.0 Percent 42.5 26.6 17.8 9.5 3.6 Cum % 42.5 69.1 86.9 96.4 100.0Number of Defects by Type 140 100 120 80 100 80 60 Frequency Percent 60 40 40 20 20 Type of Defect art sing Solder Defect Incorrect assembly Other ( Types) Board Surface Finish Problem Frequency 56 39 26 9 E Percent 40.6 283 18.8 65 5.8. Cum % 40.6 68.8 87.7 94.2 100.0
Step by Step Solution
There are 3 Steps involved in it

Get step-by-step solutions from verified subject matter experts