

Question: I need help going through that data and doing the formulas in excel. I am just confused on how to do this assignment. I don't
I need help going through that data and doing the formulas in excel. I am just confused on how to do this assignment. I don't understand what they mean by columns and such like naming them.
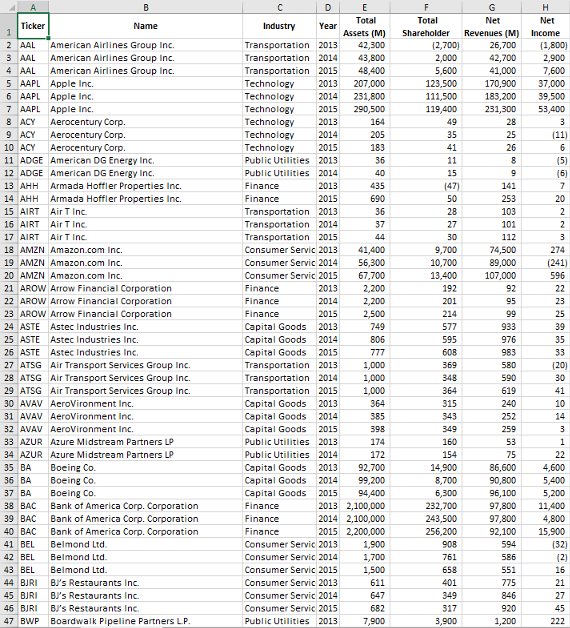
example data is attached
Requirements:
Work through the instructions below. As you work, youll be asked to:
Follow the steps to perform the required analysis.
Answer questions, many of which require PivotTables.
The first thing you need to do is calculate the four ratios:
In column I calculate Return on Equity. Format the cells as a percentage with decimals
In column J calculate Profit Margin. Format the cells as a percentage with decimals
In column K calculate Asset Turnover. Format the cells as a number with decimals
In column L calculate Financial Leverage. Format the cells as a number with decimals
What is the calculation for Return on Equity?
What is the calculation for Return on Investment?
Ignoring other ratios, would a company rather have a High or Low Return on Equity?
Ignoring other ratios, would a company rather have a High or Low Asset Turnover?
Which of the four DuPont ratios is the best measure of risk?
If a company experiences a net operating loss, which ratios are likely to be negative? list
How many rows of company data dont count headingsare in the file?
How many different years are included in the file?
What is the heading of the column that includes the code NASDAQ uses to uniquely identify each company?
Step by Step Solution
There are 3 Steps involved in it
1 Expert Approved Answer
Step: 1 Unlock

Question Has Been Solved by an Expert!
Get step-by-step solutions from verified subject matter experts
Step: 2 Unlock
Step: 3 Unlock