

Question: i need help graphing these number and inserting numbers onto the advertising budget chart and fixing my work. thank you. Wrap Text Cut General 9.
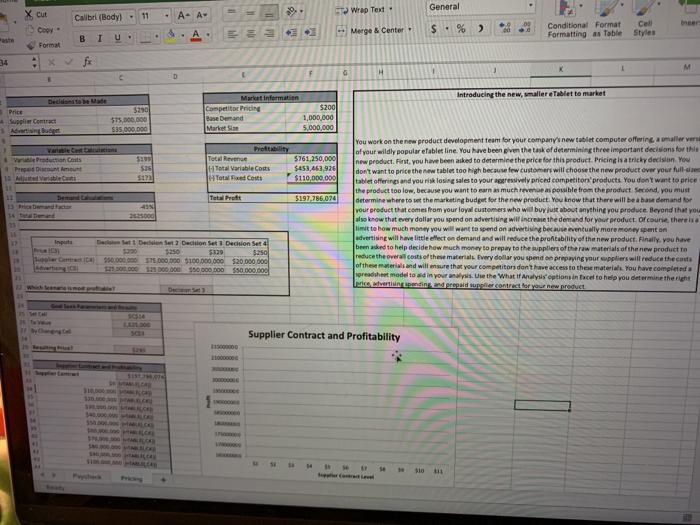
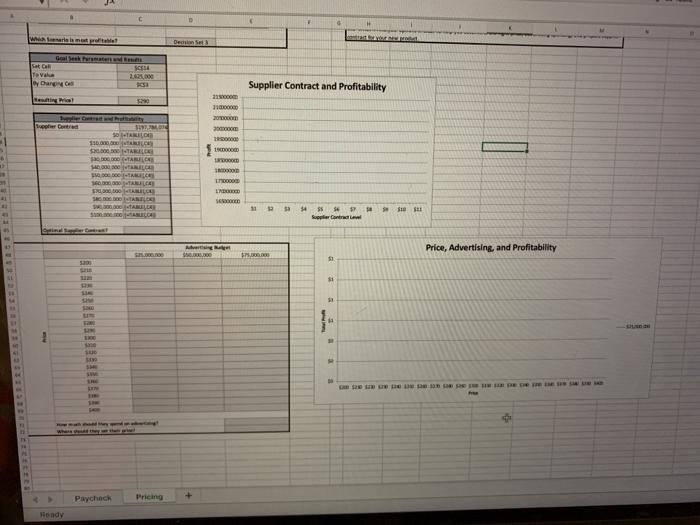
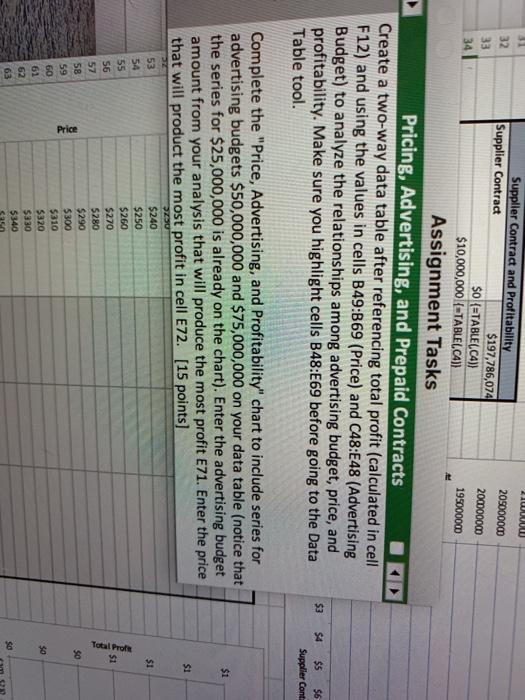
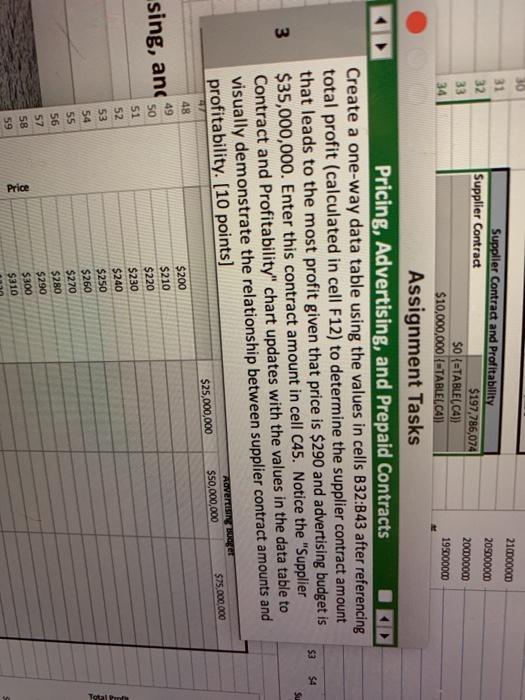
Wrap Text Cut General 9. Calibrl(Body) - 11 A- A+ Coy Merge Center $ . % ) 4. A Conditional Format Cell Formatting as Table Styles B 1 Format H D Introducing the new, mallereTabletto market $290 575.000.000 S35 000 000 Market information Competitor Pricing $200 Base Demand 1,000,000 Market 5,000,000 Anbud Van Corts Preden S $36 Total Revenue Total VariableCous Total costs 5761,250,000 $453,463,926 $110,000,000 11 11 Total Prat $197.286.074 495 25000 You work on the new product development team for your company new tablet computer offering a smaller ve of your wildly populareablet line. You have been given the task of determining three important decidons for the new product. First, you have been asked to determine the price for this product. Pricingisatricky decision. You don't want to pricethew tablet too gh because few customers will choose the new product over your full tablet offerings and you risk losing sales to your aggressively priced competitor products. You don't want to price the product too low, because you want to earn as much even as possible from the product Second, you must determine where to set the marketing budget for the new product. You know that there will be a base demand for your product that comes from your loyal customers who will buy just about anything you produce Beyond that you also know that every dollar you spend on advertising will increase the demand for your product of course therehe timit te how much money you will want to spend on advertising because eventually more money spent on advertising will have little effect on demand and will reduce the profitability of the new product. Finally, you have been asked to help decide how much money to prepay to the suppliers of the raw materials of the new product to reduce the overall costs of these materials. Every dollar you spend on preparing your suppliers will reduce the cost of the materials and will ensure that your competitors don't have access to the material. You have completed prehet model to al in your ans. Use the What Analysis optionsince to help you determine the right Linnad turpe contest for your news us Input De De Deco Decision Set 4 20 $250 5829 $250 950.000 1.000.000 $100.000.000 $20 000 000 B00011000000 SO DOO DOD 550 000.000 14 Supplier Contract and Profitability 140.000 14 11 Se Bio Det NO Sa Cal teve Dar es 2020 13 Supplier Contract and Profitability WOOOSTE ting 110.000 20 opper Care BE TAILOR S. DETAIL TARIO LLC DARILO 15 1 GOGNE mi ABELLA $4 10 Supplier M SED Price, Advertising and Profitability . 1 ES 13 $ 1 11 ant He the Paychech Pricing Bondy 209000000 32 33 34 2000000 19500000 Supplier Contract and Profitability Supplier Contract $197,786,074 $0 (=TABLE(C4) $10,000,000 (=TABLE(C4}} Assignment Tasks Pricing, Advertising, and Prepaid Contracts Create a two-way data table after referencing total profit (calculated in cell F12) and using the values in cells B49:869 (Price) and C48:E48 (Advertising Budget) to analyze the relationships among advertising budget, price, and profitability. Make sure you highlight cells B48:E69 before going to the Data Table tool. $3 $4 $5 $6 Supplier Cont $1 Complete the "Price, Advertising, and Profitability" chart to include series for advertising budgets $50,000,000 and $75,000,000 on your data table (notice that the series for $25,000,000 is already on the chart). Enter the advertising budget amount from your analysis that will produce the most profit E71. Enter the price that will product the most profit in cell E72. (15 points) $240 SI SU $1 Total Prof $1 53 54 55 56 57 58 59 60 61 62 63 $250 $260 $270 5280 $290 $300 $310 $320 5330 $340 $0 Price 30 30 2100000M 205000000 2000com 19500000 31 Supplier Contract and Profitability 32 Supplier Contract $197,786,074 33 $0 (=TABLE(C4)) 34 $10,000,000/=TABLELC4)). Assignment Tasks Pricing, Advertising, and Prepaid Contracts Create a one-way data table using the values in cells B32:B43 after referencing total profit (calculated in cell F12) to determine the supplier contract amount that leads to the most profit given that price is $290 and advertising budget is $35,000,000. Enter this contract amount in cell 045. Notice the "Supplier Contract and Profitability" chart updates with the values in the data table to visually demonstrate the relationship between supplier contract amounts and profitability. (10 points) $25,000,000 $50,000,000 $3 SA 3 Advertising ager $75.000.000 48 49 sing, and 50 $200 $210 $220 $230 $240 $250 $260 $270 $280 51 52 53 54 55 56 57 58 59 Total Price $290 $300 $310 Wrap Text Cut General 9. Calibrl(Body) - 11 A- A+ Coy Merge Center $ . % ) 4. A Conditional Format Cell Formatting as Table Styles B 1 Format H D Introducing the new, mallereTabletto market $290 575.000.000 S35 000 000 Market information Competitor Pricing $200 Base Demand 1,000,000 Market 5,000,000 Anbud Van Corts Preden S $36 Total Revenue Total VariableCous Total costs 5761,250,000 $453,463,926 $110,000,000 11 11 Total Prat $197.286.074 495 25000 You work on the new product development team for your company new tablet computer offering a smaller ve of your wildly populareablet line. You have been given the task of determining three important decidons for the new product. First, you have been asked to determine the price for this product. Pricingisatricky decision. You don't want to pricethew tablet too gh because few customers will choose the new product over your full tablet offerings and you risk losing sales to your aggressively priced competitor products. You don't want to price the product too low, because you want to earn as much even as possible from the product Second, you must determine where to set the marketing budget for the new product. You know that there will be a base demand for your product that comes from your loyal customers who will buy just about anything you produce Beyond that you also know that every dollar you spend on advertising will increase the demand for your product of course therehe timit te how much money you will want to spend on advertising because eventually more money spent on advertising will have little effect on demand and will reduce the profitability of the new product. Finally, you have been asked to help decide how much money to prepay to the suppliers of the raw materials of the new product to reduce the overall costs of these materials. Every dollar you spend on preparing your suppliers will reduce the cost of the materials and will ensure that your competitors don't have access to the material. You have completed prehet model to al in your ans. Use the What Analysis optionsince to help you determine the right Linnad turpe contest for your news us Input De De Deco Decision Set 4 20 $250 5829 $250 950.000 1.000.000 $100.000.000 $20 000 000 B00011000000 SO DOO DOD 550 000.000 14 Supplier Contract and Profitability 140.000 14 11 Se Bio Det NO Sa Cal teve Dar es 2020 13 Supplier Contract and Profitability WOOOSTE ting 110.000 20 opper Care BE TAILOR S. DETAIL TARIO LLC DARILO 15 1 GOGNE mi ABELLA $4 10 Supplier M SED Price, Advertising and Profitability . 1 ES 13 $ 1 11 ant He the Paychech Pricing Bondy 209000000 32 33 34 2000000 19500000 Supplier Contract and Profitability Supplier Contract $197,786,074 $0 (=TABLE(C4) $10,000,000 (=TABLE(C4}} Assignment Tasks Pricing, Advertising, and Prepaid Contracts Create a two-way data table after referencing total profit (calculated in cell F12) and using the values in cells B49:869 (Price) and C48:E48 (Advertising Budget) to analyze the relationships among advertising budget, price, and profitability. Make sure you highlight cells B48:E69 before going to the Data Table tool. $3 $4 $5 $6 Supplier Cont $1 Complete the "Price, Advertising, and Profitability" chart to include series for advertising budgets $50,000,000 and $75,000,000 on your data table (notice that the series for $25,000,000 is already on the chart). Enter the advertising budget amount from your analysis that will produce the most profit E71. Enter the price that will product the most profit in cell E72. (15 points) $240 SI SU $1 Total Prof $1 53 54 55 56 57 58 59 60 61 62 63 $250 $260 $270 5280 $290 $300 $310 $320 5330 $340 $0 Price 30 30 2100000M 205000000 2000com 19500000 31 Supplier Contract and Profitability 32 Supplier Contract $197,786,074 33 $0 (=TABLE(C4)) 34 $10,000,000/=TABLELC4)). Assignment Tasks Pricing, Advertising, and Prepaid Contracts Create a one-way data table using the values in cells B32:B43 after referencing total profit (calculated in cell F12) to determine the supplier contract amount that leads to the most profit given that price is $290 and advertising budget is $35,000,000. Enter this contract amount in cell 045. Notice the "Supplier Contract and Profitability" chart updates with the values in the data table to visually demonstrate the relationship between supplier contract amounts and profitability. (10 points) $25,000,000 $50,000,000 $3 SA 3 Advertising ager $75.000.000 48 49 sing, and 50 $200 $210 $220 $230 $240 $250 $260 $270 $280 51 52 53 54 55 56 57 58 59 Total Price $290 $300 $310
Step by Step Solution
There are 3 Steps involved in it

Get step-by-step solutions from verified subject matter experts