

Question: I need help - I just do not understand. Below are four sets of data. Answer the following questions about each set of data. Data
I need help - I just do not understand.
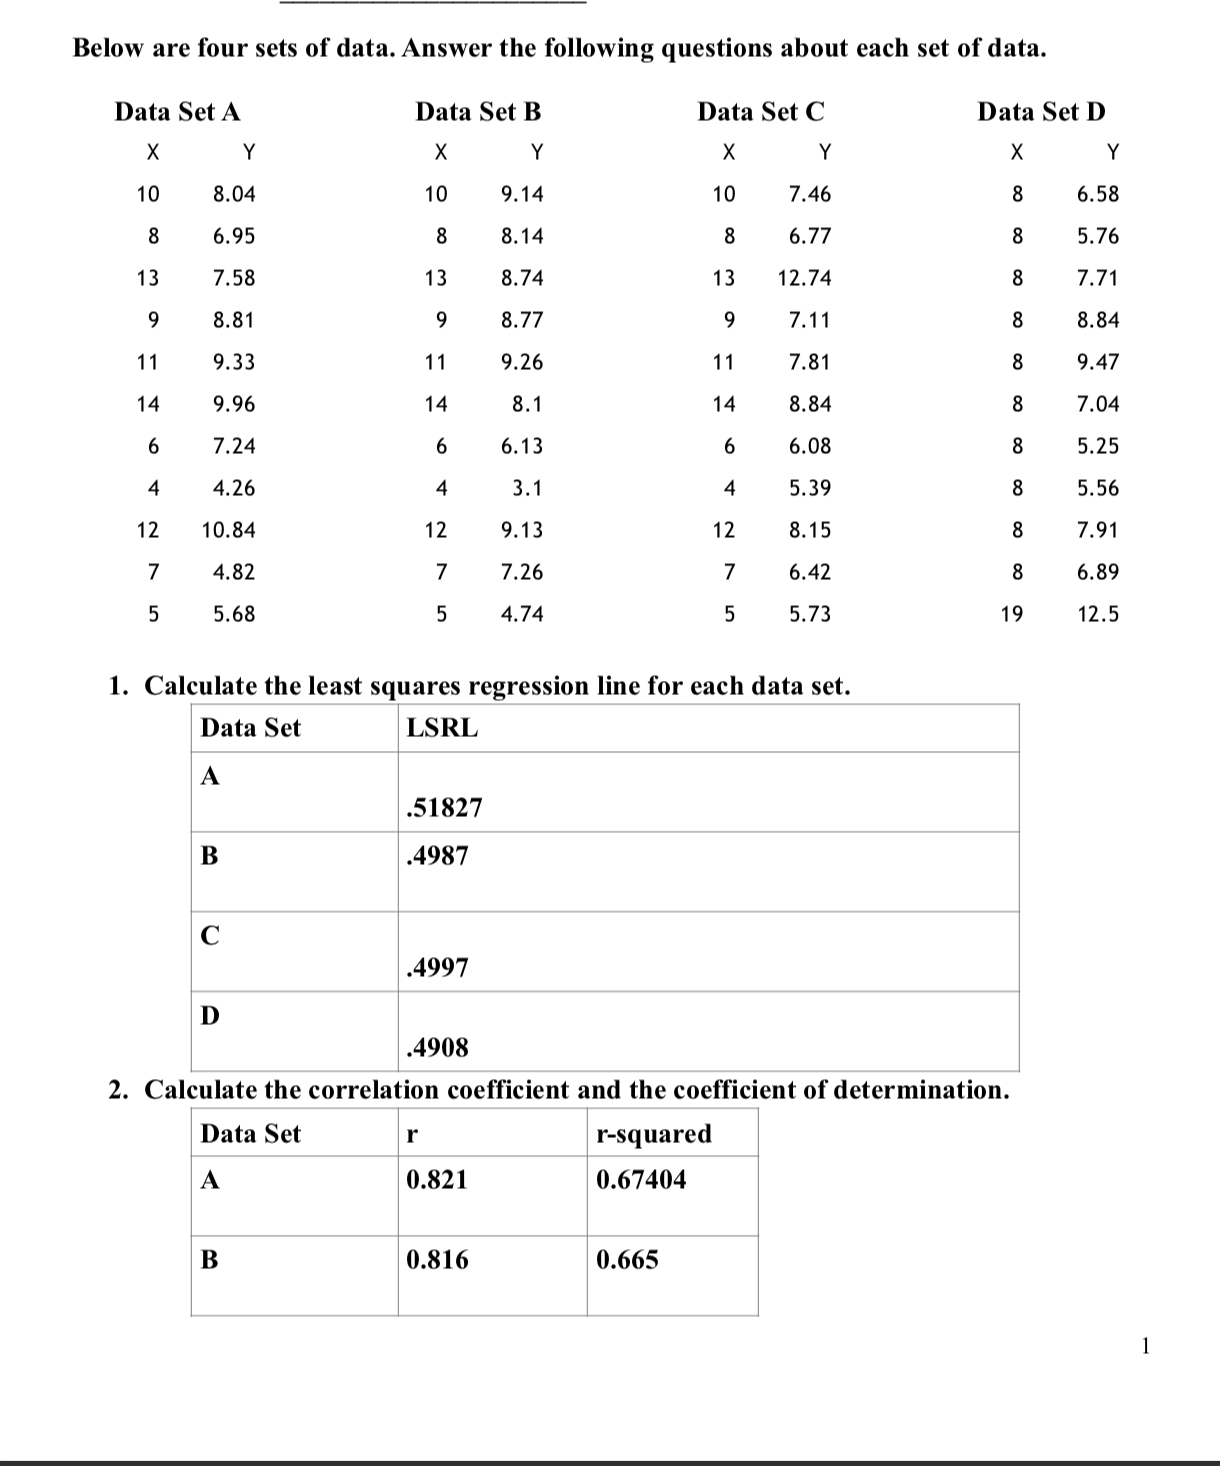
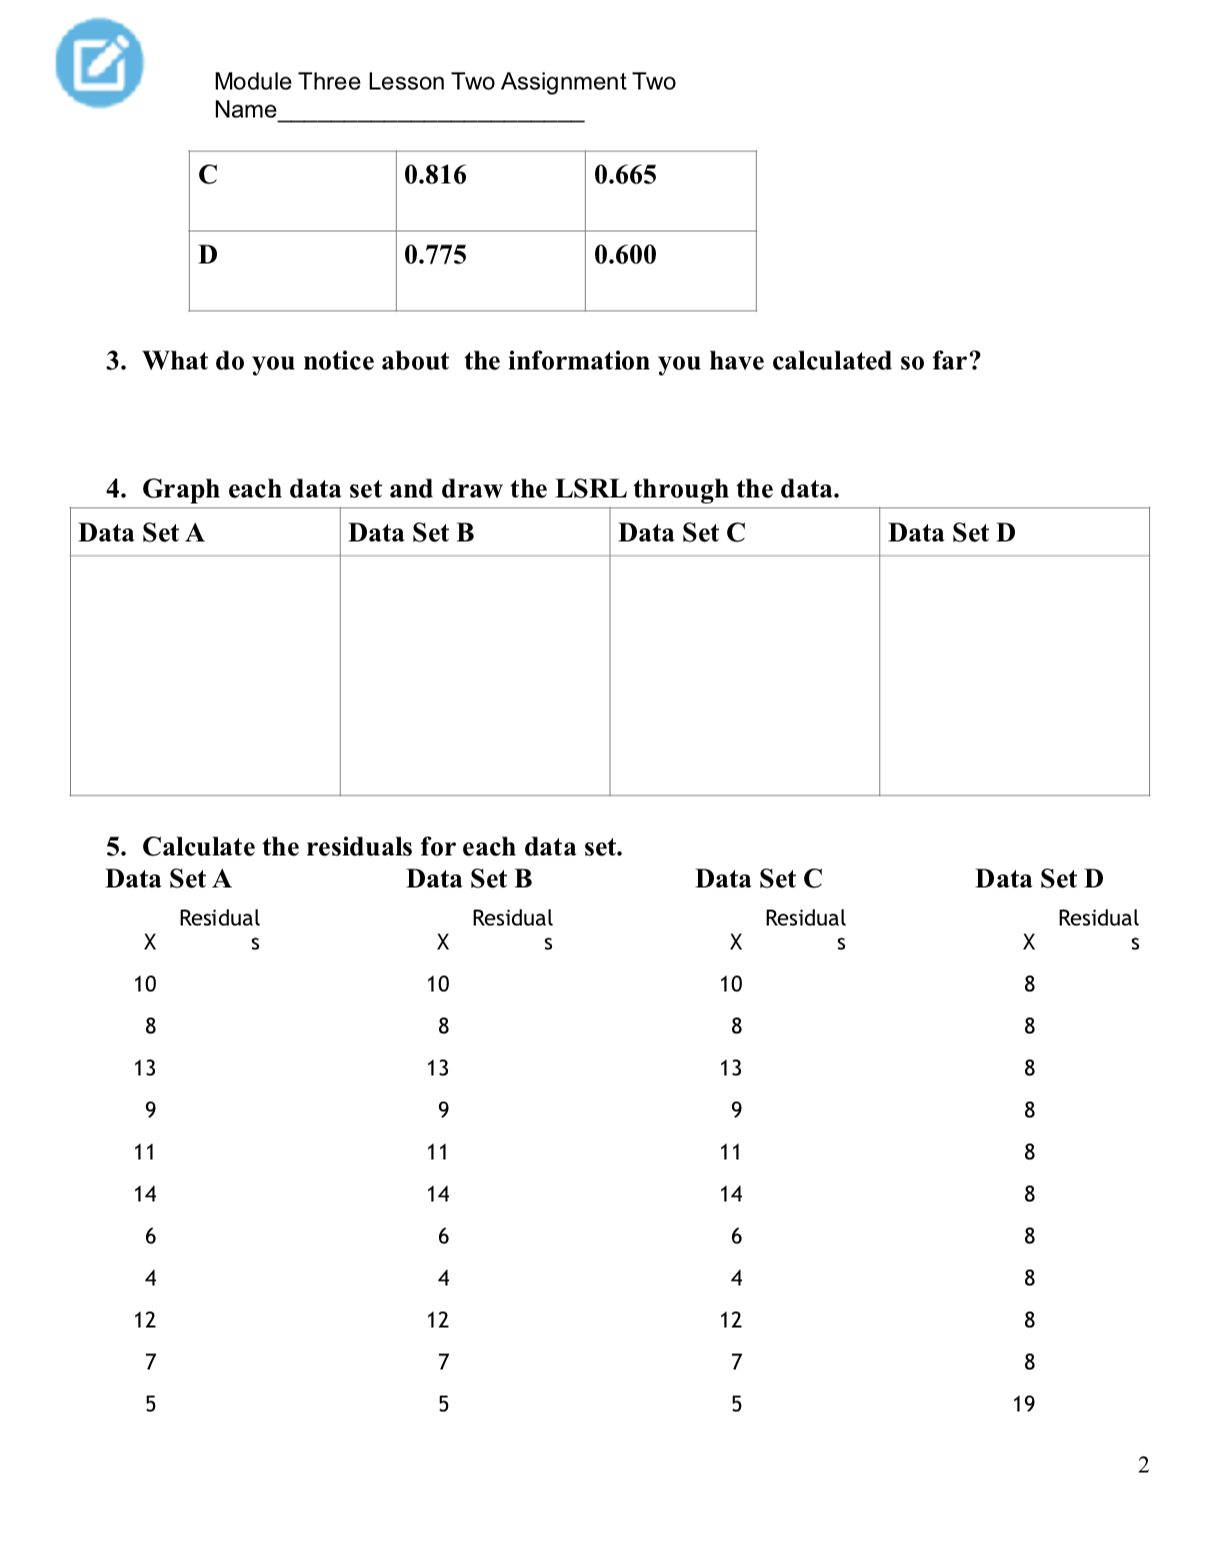
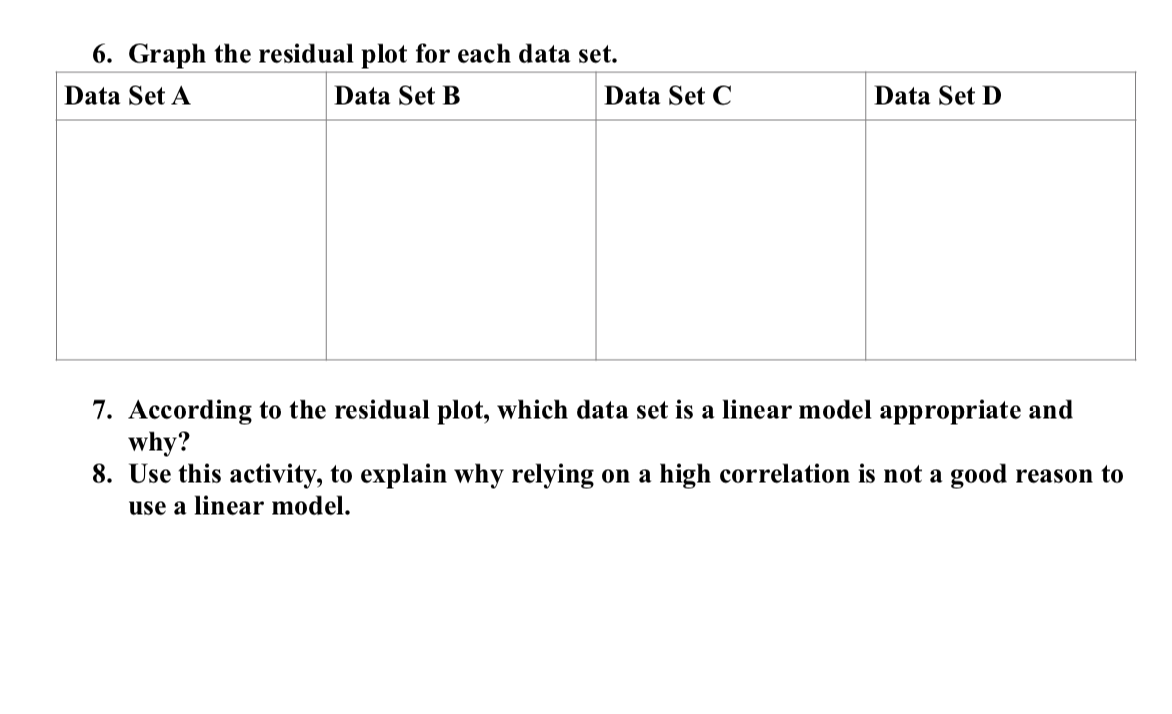
Below are four sets of data. Answer the following questions about each set of data. Data Set A X Y 10 8.04 8 6.95 13 7.58 9 8.81 11 9.33 14 9.96 6 7.24 4 4.26 12 10. 84 7 4.82 5 5.68 1. Calculate the least squares regression line for each data set. Data Set B X Y 10 9.14 8 8.14 13 8.74 9 8.77 11 9.26 14 8.1 6 6.13 4 3.1 12 9.13 7 7.26 5 4.74 Data Set C X Y 10 7.46 8 6.77 13 12.74 9 7.11 11 7.81 14 8.84 6 6.08 4 5.39 12 8.15 7 6.42 5 5.73 X oooooooooooooooooooo _L \\D Data Set LSRL A .51827 B .4987 C .4997 D .4908 2. Calculate the correlation coefficient and the coefficient of determination. Data Set r r-squared A 0.821 0.67404 B 0.816 0.665 Data Set D Y 6.58 5.76 7.71 8.84 9.47 7.04 5.25 5.56 7.91 6.89 12.5 @ Module Three Lesson Two Assignment Two Name 3. What do you notice about the information you have calculated so far? 4. Graph each data set and draw the LSRL through the data. Data Set A Data Set B Data Set C Data Set D 5. Calculate the residuals for each data set. Data Set A Data Set B Data Set C Data Set D Residual Residual Residual Residual X s X s X s X s 10 10 10 8 8 8 8 8 13 13 13 8 9 9 9 8 11 11 11 8 14 14 14 a 6 6 6 8 4 4 4 8 12 12 12 8 7 7 7 8 5 5 5 19 6. Graph the residual plot for each data set. Data Set A Data Set B Data Set C Data Set D 7. According to the residual plot, which data set is a linear model appropriate and why? 8. Use this activity, to explain why relying on a high correlation is not a good reason to use a linear model
Step by Step Solution
There are 3 Steps involved in it

Get step-by-step solutions from verified subject matter experts