Question: i need help, i'm really confused Assuming a normal distribution, determine the precent of data to the left of the z-score: z = 1.42 Select
i need help, i'm really confused
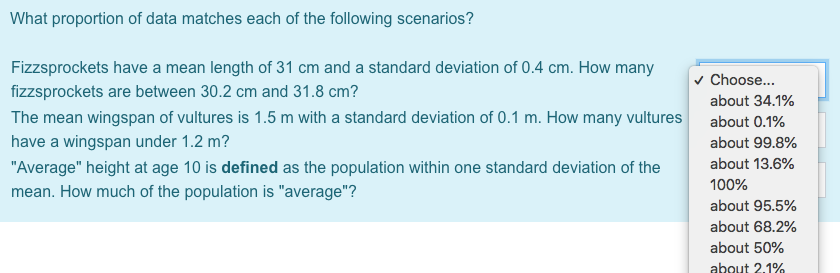
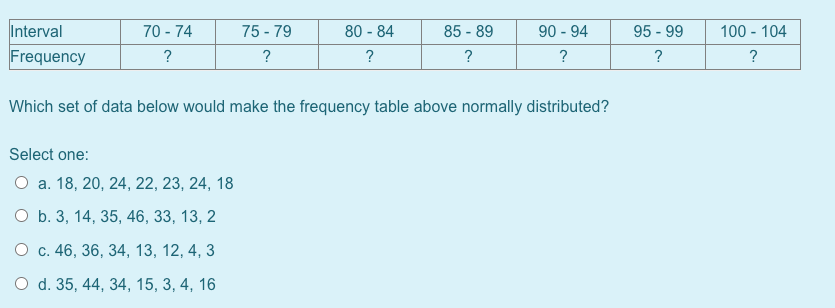
Assuming a normal distribution, determine the precent of data to the left of the z-score: z = 1.42 Select one: O a. 92.22% O b. 91.92% O c. 93.57% O d. 90.66%Determine the z-score for the given value. # = 255, a = 40, x = 155 Select one: O a. 2 O b. -2.5 O c. 2.5 O d. 1.5 O e. -1.5 Of. -2At the end of a day at the bowling alley, three friends analyzed their scores. Mitchell's mean bowling score is 136 with a standard deviation of 17. Kris's mean bowling score is 125 with a standard deviation of 25. Dominic's mean bowling score is 149 with a standard deviation of 20. Who is the most consistent bowler? Select one: O a. Mitchell O b. Dominic O c. Not enough information to know. O d. KrisTest scores for the statistics unit exam are normally distributed with a mean score of 79% and a standard deviation of 5%. Since it's a stats test, students are given their score as a z-score. (Ha ha ha! So funny, Mr. Armstrong..) If a student received thier grade as a z-score of 3, determine the student's grade on the test. Select one: O a. 89% O b. 94% O c. 69% O d. 74% O e. 84% O f. 64%What proportion of data matches each of the following scenarios? Fizzsprockets have a mean length of 31 cm and a standard deviation of 0.4 cm. How many fizzsprockets are between 30.2 cm and 31.8 cm? Choose.. about 34.1% The mean wingspan of vultures is 1.5 m with a standard deviation of 0.1 m. How many vultures about 0.1% have a wingspan under 1.2 m? about 99.8% "Average" height at age 10 is defined as the population within one standard deviation of the about 13.6% mean. How much of the population is "average"? 100% about 95.5% about 68.2% about 50% about 2.1%Interval 70 - 74 75 - 79 80 - 84 85 - 89 90 - 94 95 - 99 100 - 104 Frequency ? ? ? ? ? ? ? Which set of data below would make the frequency table above normally distributed? Select one: O a. 18, 20, 24, 22, 23, 24, 18 O b. 3, 14, 35, 46, 33, 13, 2 O c. 46, 36, 34, 13, 12, 4, 3 O d. 35, 44, 34, 15, 3, 4, 16