

Question: I need help in question 2, 3, 4, 5, 6, 7. Example regression questions (Sales is the dep var): Summary of Fit RSgyare RSquare Adj
I need help in question 2, 3, 4, 5, 6, 7.
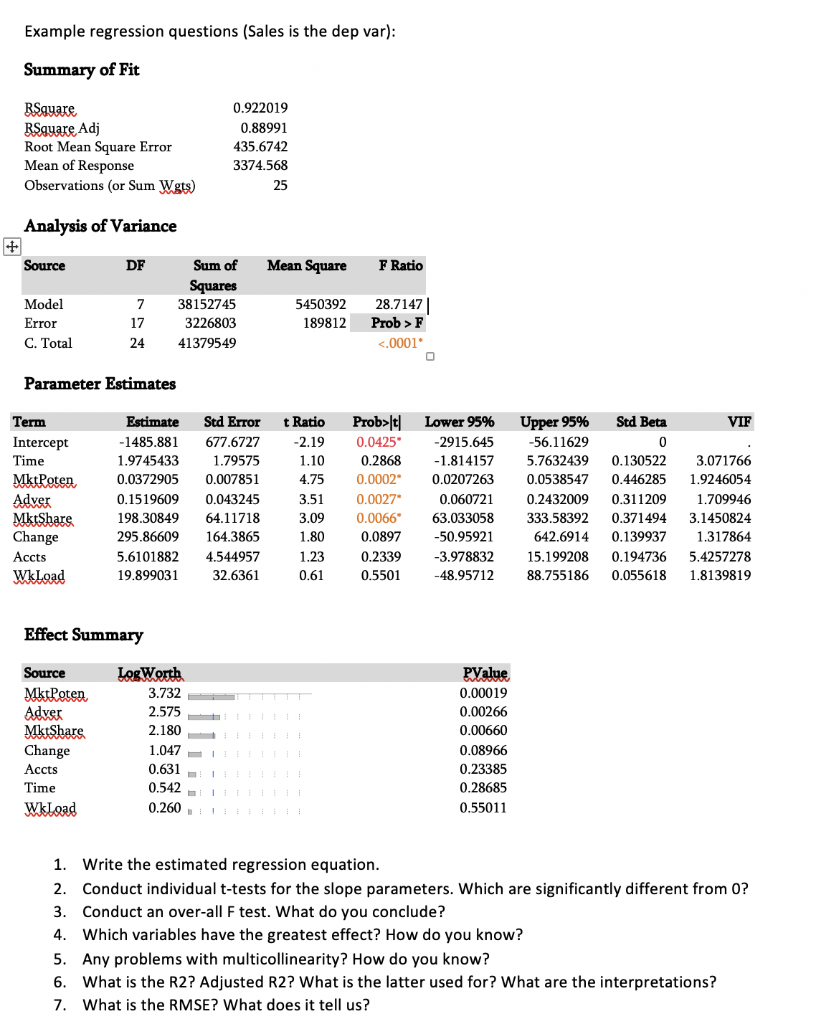
Example regression questions (Sales is the dep var): Summary of Fit RSgyare RSquare Adj Root Mean Square Error Mean of Response Observations (or Sum Wgts) 0.922019 0.88991 435.6742 3374.568 Analysis of Variance Source DF Mean Square F Ratio Model Sum of Squares 38152745 3226803 41379549 7 17 24 5450392 189812 Error 28.7147 Prob > F <.0001 c. total parameter estimates vif term intercept time mktpoten adver mktshare change accts wkload std errort ratio prob>lt 0.0425 0.2868 0.0002 0.0027* 0.0066 0.0897 0.2339 0.5501 Lower 95% -2915.645 -1.814157 0.0207263 0.060721 63.033058 -50.95921 -3.978832 -48.95712 Upper 95% Std Beta -56.11629 5.7632439 0.130522 0.0538547 0.446285 0.24320090.311209 333.58392 0.371494 642.6914 0.139937 15.199208 0.194736 88.755186 0.055618 3.071766 1.9246054 1.709946 3.1450824 1.317864 5.4257278 1.8139819 Effect Summary Source MktPoten Adver MktShare Change Accts Time Wkload LogWorth 3.732 2.575 2.180 1.047 0.631 ! 0.542 0.260LED PValue 0.00019 0.00266 0.00660 0.08966 0.23385 0.28685 0.55011 ! ! 1. Write the estimated regression equation. 2. Conduct individual t-tests for the slope parameters. Which are significantly different from 0? 3. Conduct an over-all F test. What do you conclude? 4. Which variables have the greatest effect? How do you know? 5. Any problems with multicollinearity? How do you know? 6. What is the R2? Adjusted R2? What is the latter used for? What are the interpretations? 7. What is the RMSE? What does it tell us? Example regression questions (Sales is the dep var): Summary of Fit RSgyare RSquare Adj Root Mean Square Error Mean of Response Observations (or Sum Wgts) 0.922019 0.88991 435.6742 3374.568 Analysis of Variance Source DF Mean Square F Ratio Model Sum of Squares 38152745 3226803 41379549 7 17 24 5450392 189812 Error 28.7147 Prob > F <.0001 c. total parameter estimates vif term intercept time mktpoten adver mktshare change accts wkload std errort ratio prob>lt 0.0425 0.2868 0.0002 0.0027* 0.0066 0.0897 0.2339 0.5501 Lower 95% -2915.645 -1.814157 0.0207263 0.060721 63.033058 -50.95921 -3.978832 -48.95712 Upper 95% Std Beta -56.11629 5.7632439 0.130522 0.0538547 0.446285 0.24320090.311209 333.58392 0.371494 642.6914 0.139937 15.199208 0.194736 88.755186 0.055618 3.071766 1.9246054 1.709946 3.1450824 1.317864 5.4257278 1.8139819 Effect Summary Source MktPoten Adver MktShare Change Accts Time Wkload LogWorth 3.732 2.575 2.180 1.047 0.631 ! 0.542 0.260LED PValue 0.00019 0.00266 0.00660 0.08966 0.23385 0.28685 0.55011 ! ! 1. Write the estimated regression equation. 2. Conduct individual t-tests for the slope parameters. Which are significantly different from 0? 3. Conduct an over-all F test. What do you conclude? 4. Which variables have the greatest effect? How do you know? 5. Any problems with multicollinearity? How do you know? 6. What is the R2? Adjusted R2? What is the latter used for? What are the interpretations? 7. What is the RMSE? What does it tell us
Step by Step Solution
There are 3 Steps involved in it

Get step-by-step solutions from verified subject matter experts