

Question: I need help in statistical graphics question QUESTION : CONTINUED (c) Consider the following graphic from the article No more damned lies... by David Spiegelhalter
- I need help in statistical graphics question
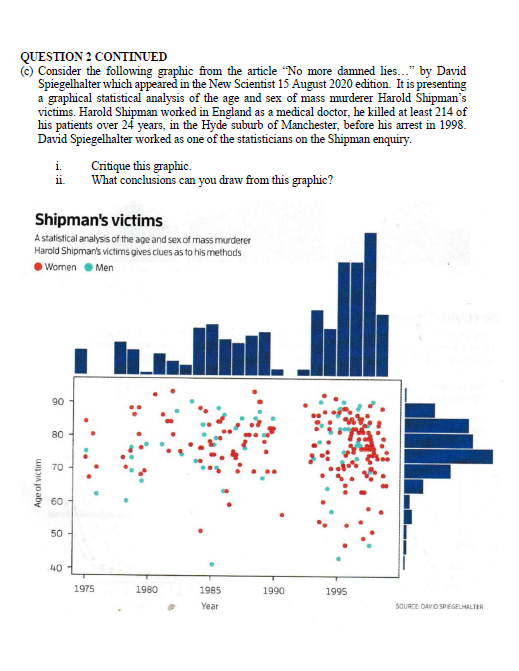
QUESTION : CONTINUED (c) Consider the following graphic from the article "No more damned lies..." by David Spiegelhalter which appeared in the New Scientist 15 August 2020 edition. It is presenting a graphical statistical analysis of the age and sex of mass murderer Harold Shipman's victims. Harold Shipman worked in England as a medical doctor, he killed at least 214 of his patients over 24 years, in the Hyde suburb of Manchester, before his arrest in 1998. David Spiegelhalter worked as one of the statisticians on the Shipman enquiry. Critique this graphic. What conclusions can you draw from this graphic? Shipman's victims A statistical analysis of the age and sex of mass murderer Harold Shipman's victims gives clues as to his methods Women @ Men 90 80 Age of victim 70 50 50 1975 1980 1985 1990 1995 Year SOURCE DAVID SPIEGELHALTER
Step by Step Solution
There are 3 Steps involved in it

Get step-by-step solutions from verified subject matter experts