Question: I need help in these tasks, Please help me with these and also help me in the questions, I will be thankful I did first
I need help in these tasks, Please help me with these and also help me in the questions, I will be thankful I did first task, need to do second onwards
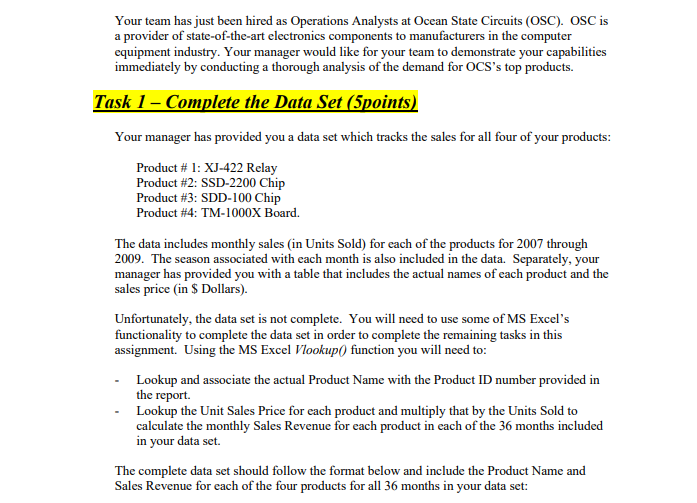
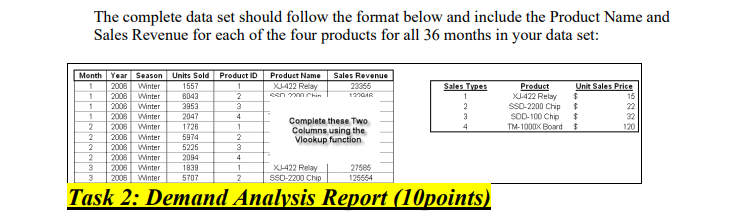
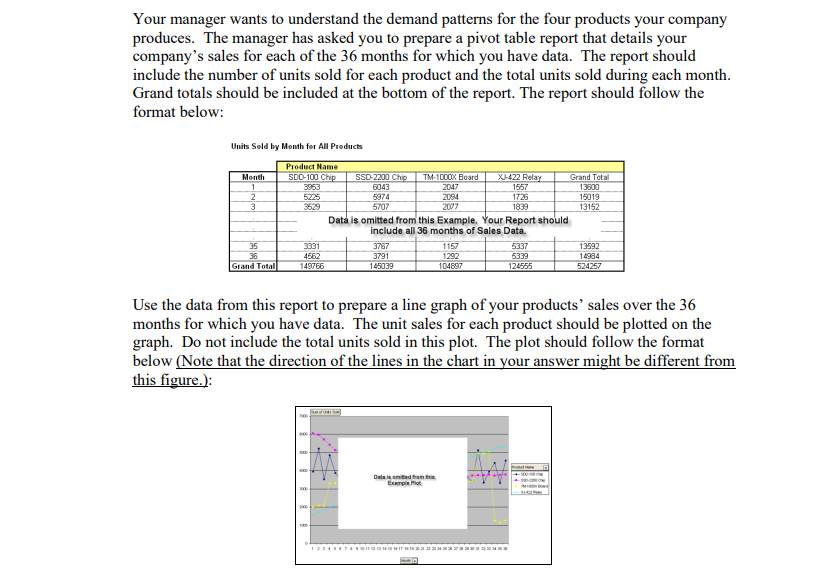
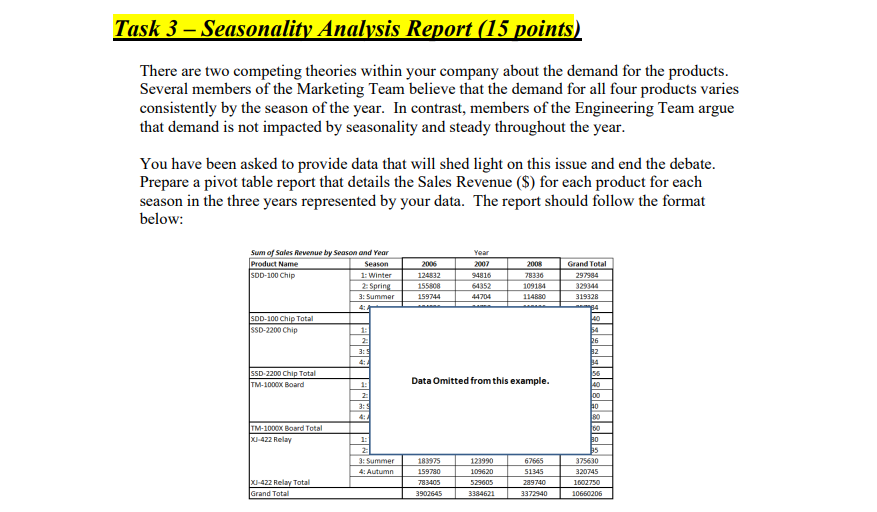
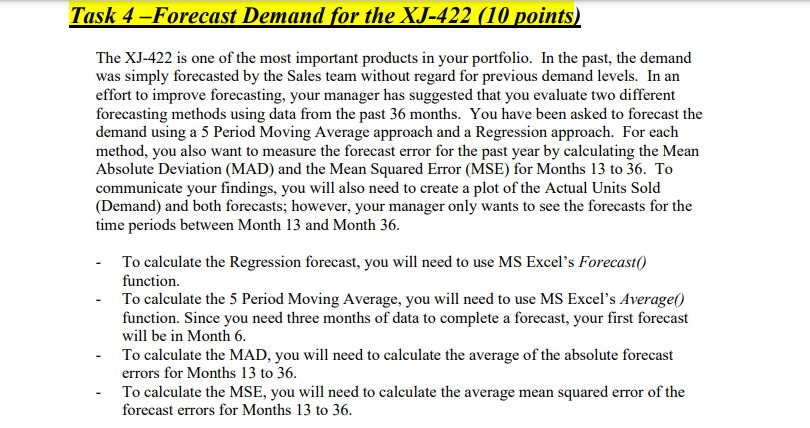
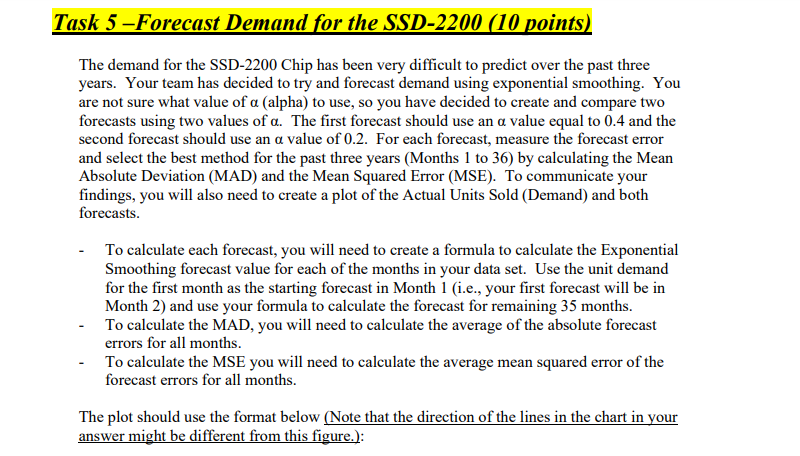
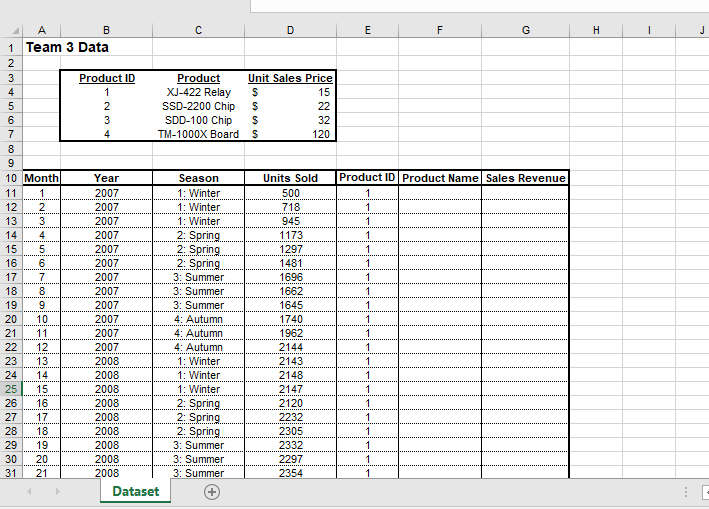
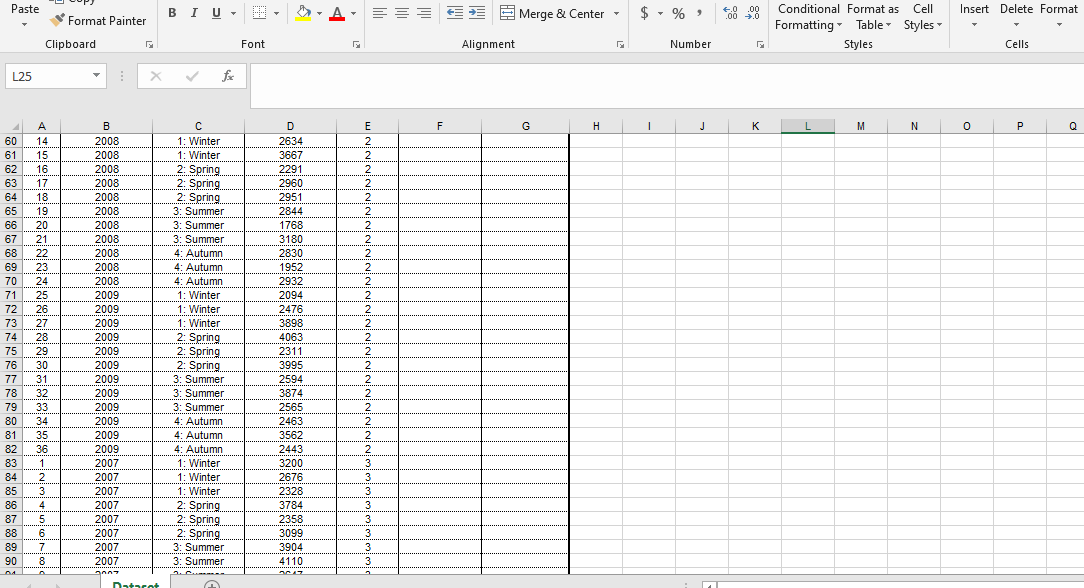
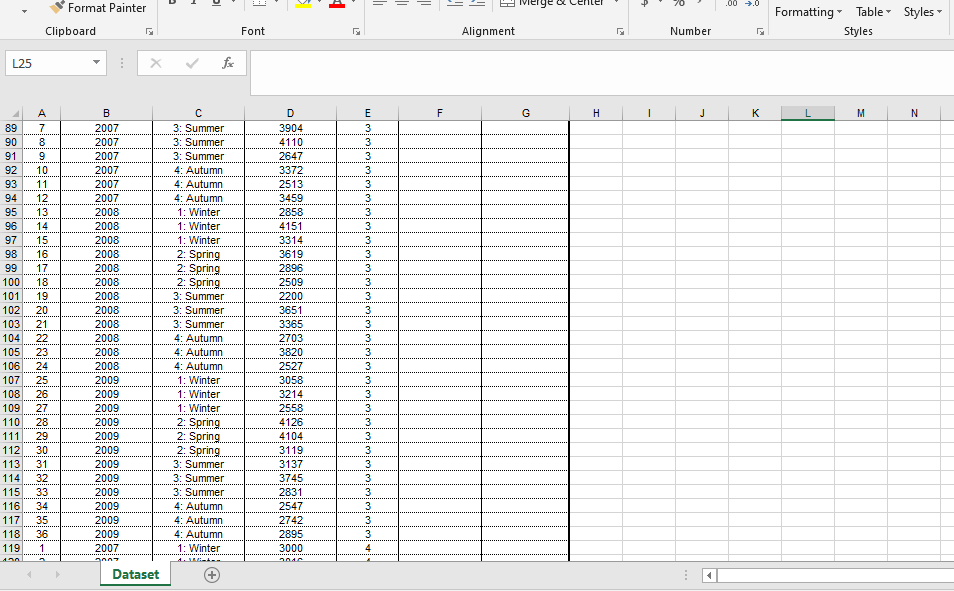
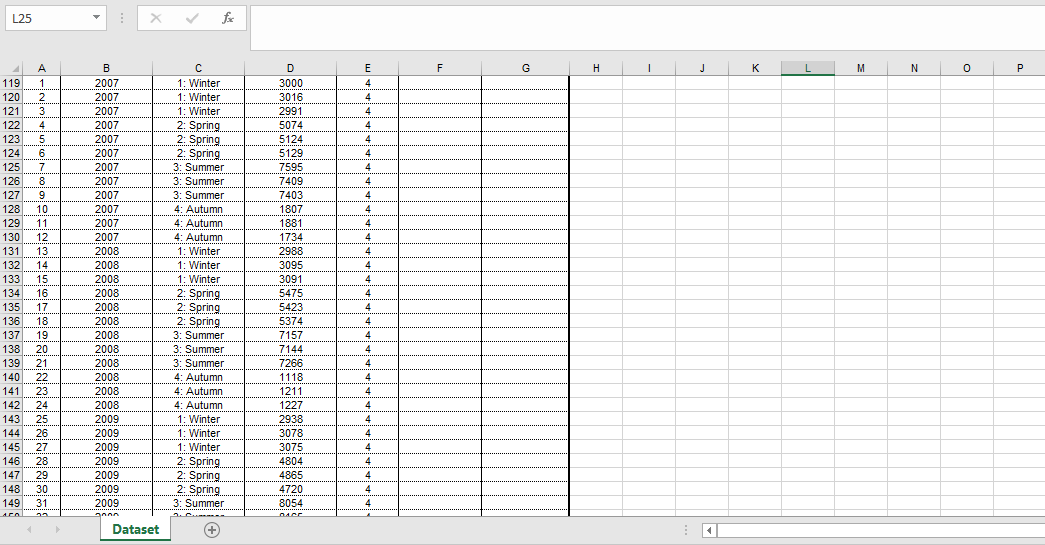
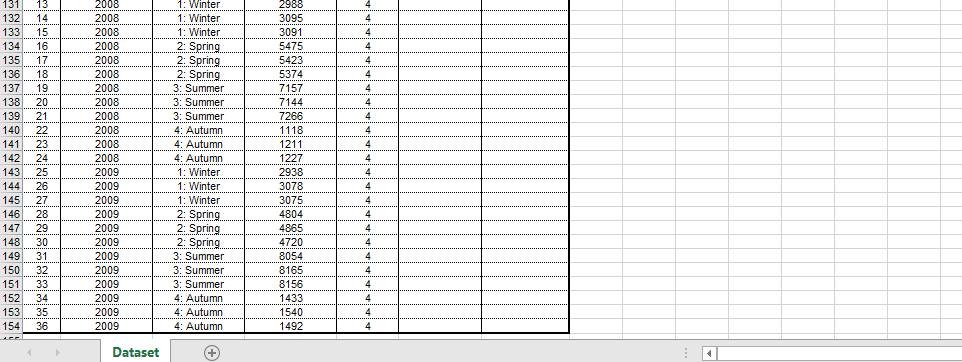
Your team has just been hired as Operations Analysts at Ocean State Circuits (OSC). OSC is a provider of state-of-the-art electronics components to manufacturers in the computer equipment industry. Your manager would like for your team to demonstrate your capabilities immediately by conducting a thorough analysis of the demand for OCS's top products. Task 1 - Complete the Data Set (5points) Your manager has provided you a data set which tracks the sales for all four of your products: Product # 1: XJ-422 Relay Product #2: SSD-2200 Chip Product #3: SDD-100 Chip Product #4: TM-1000X Board. The data includes monthly sales in Units Sold) for each of the products for 2007 through 2009. The season associated with each month is also included in the data. Separately, your manager has provided you with a table that includes the actual names of each product and the sales price in $ Dollars). Unfortunately, the data set is not complete. You will need to use some of MS Excel's functionality to complete the data set in order to complete the remaining tasks in this assignment. Using the MS Excel Vlookup() function you will need to: - Lookup and associate the actual Product Name with the Product ID number provided in the report. Lookup the Unit Sales Price for each product and multiply that by the Units Sold to calculate the monthly Sales Revenue for each product in each of the 36 months included in your data set. The complete data set should follow the format below and include the Product Name and Sales Revenue for each of the four products for all 36 months in your data set: The complete data set should follow the format below and include the Product Name and Sales Revenue for each of the four products for all 36 months in your data set: Product Name XJ-422 Relay een Chin Sales Revenue 23066 19701 Month Year Season Units Sold 1 2008 Winter 1557 1 2008 Winter 3043 1 2008 Winter 3952 1 Winter 2047 2 2003 Winter 1726 2 2008 Winter 5974 2 2008 Winter 5225 2 2003 Winter 2094 3 Winter 1839 3 2006 Winter 5707 Sales Types 1 2 a 4 Product ID 1 2 3 4 1 2 3 4 1 2 Product X1.422 Relay SSO-2200 Chip SOD-100 Chip TIM-1000X Board 8 Unit Sales Price 15 $ 32 $ 120 2002 Complete these two Columns using the Vlookup function 27585 X1422 Relay SSD-2200 Chip 125554 Task 2: Demand Analysis Report (10points) Your manager wants to understand the demand patterns for the four products your company produces. The manager has asked you to prepare a pivot table report that details your company's sales for each of the 36 months for which you have data. The report should include the number of units sold for each product and the total units sold during each month. Grand totals should be included at the bottom of the report. The report should follow the format below: Units Sold by Month for All Products Month 2 3 Product Name SDD-100 Chip SSD-2200 Chip TM-1000X Board XJ-422 Relay Grand Total 3953 6043 2047 1657 13800 5225 5974 2084 1726 15019 3629 5707 2077 1839 13152 Data is omitted from this Example. Your Report should include all 36 months of Sales Data 3831 3767 1157 5337 13592 4562 3791 1292 5339 14984 149766 145039 104897 124555 524257 35 36 Grand Total Use the data from this report to prepare a line graph of your products' sales over the 36 months for which you have data. The unit sales for each product should be plotted on the graph. Do not include the total units sold in this plot. The plot should follow the format below (Note that the direction of the lines in the chart in your answer might be different from this figure.): Data isted from Example Plot MIT Task 2 Questions: In addition to preparing the reports, your manager has asked for you to analyze them to see if you can identify any patterns in the demand. Specifically, your manager would like you to: 1. Examine the data in the pivot table report and in the graph. Discuss any insights they provide into the sales patterns for each individual product. 2. How will these insights impact your plan to forecast the demand for each product? Task 3 - Seasonality Analysis Report (15 points) There are two competing theories within your company about the demand for the products. Several members of the Marketing Team believe that the demand for all four products varies consistently by the season of the year. In contrast, members of the Engineering Team argue that demand is not impacted by seasonality and steady throughout the year. You have been asked to provide data that will shed light on this issue and end the debate. Prepare a pivot table report that details the Sales Revenue ($) for each product for each season in the three years represented by your data. The report should follow the format below: 2006 2005 Sum of Sales Revenue by Season and Year Product Name Season SOD-100 Chip 1: Winter 2: Spring 3: Summer 124532 155808 159744 Year 2007 94816 64352 44704 79336 109184 114830 SOD-100 Chip Total SSD-2200 Chip 1: 3: SSD-2200 Chip Total TM-1000X Board Data Omitted from this example. Grand Total 297984 329340 319328 4 40 50 16 2 4 56 40 00 10 180 100 95 375630 320745 1602750 10660206 15 22 3: 4: TM-1000x Board Total X-422 Relay 1: 2 3: Summer 4: Autumn 183975 159780 783405 3902645 121990 109620 529605 3384621 67665 51345 29970 3372940 XJ-422 Relay Total Grand Total Task 3 Questions: Examine the report to determine if seasonality plays a role in your products' demand. Specifically: 3. Does seasonality play a role in the demand of any of your products? If so, which product(s) are impacted by seasonality? 4. Describe the impact of seasonality for the product(s) identified as seasonal in the previous question (estimate the relative differences in the demand levels for each season from the plot and the pivot table.) 5. Please insert ONE Bar-chart that shows the seasonality of these four products. [Hint: You need to reorganize the data from the pivot table to show all 12 quarters sales revenue of each product.] Task 4-Forecast Demand for the XJ-422 (10 points) The XJ-422 is one of the most important products in your portfolio. In the past, the demand was simply forecasted by the Sales team without regard for previous demand levels. In an effort to improve forecasting, your manager has suggested that you evaluate two different forecasting methods using data from the past 36 months. You have been asked to forecast the demand using a 5 Period Moving Average approach and a Regression approach. For each method, you also want to measure the forecast error for the past year by calculating the Mean Absolute Deviation (MAD) and the Mean Squared Error (MSE) for Months 13 to 36. To communicate your findings, you will also need to create a plot of the Actual Units Sold (Demand) and both forecasts; however, your manager only wants to see the forecasts for the time periods between Month 13 and Month 36. To calculate the Regression forecast, you will need to use MS Excel's Forecast() function. To calculate the 5 Period Moving Average, you will need to use MS Excel's Average() function. Since you need three months of data to complete a forecast, your first forecast will be in Month 6. To calculate the MAD, you will need to calculate the average of the absolute forecast errors for Months 13 to 36. To calculate the MSE, you will need to calculate the average mean squared error of the forecast errors for Months 13 to 36. The plot should use the format below: (Note that the direction of the lines in the chart in your answer might be different from this figure.) K1422 Relay Demand www. 11 Duta omitted from this example E Task 4 Questions: 6. For the past 24 months (Months 13 to 36), what are the MAD and MSE using Regression to prepare a forecast? What are the MAD and MSE for the 5 Period Moving Average for the past year (Months 13 to 36)? 7. Which method do you recommend should be used for future forecasts? Why? Task 5 -Forecast Demand for the SSD-2200 (10 points) The demand for the SSD-2200 Chip has been very difficult to predict over the past three years. Your team has decided to try and forecast demand using exponential smoothing. You are not sure what value of a (alpha) to use, so you have decided to create and compare two forecasts using two values of a. The first forecast should use an a value equal to 0.4 and the second forecast should use an a value of 0.2. For each forecast, measure the forecast error and select the best method for the past three years (Months 1 to 36) by calculating the Mean Absolute Deviation (MAD) and the Mean Squared Error (MSE). To communicate your findings, you will also need to create a plot of the Actual Units Sold (Demand) and both forecasts. To calculate each forecast, you will need to create a formula to calculate the Exponential Smoothing forecast value for each of the months in your data set. Use the unit demand for the first month as the starting forecast in Month 1 (i.e., your first forecast will be in Month 2) and use your formula to calculate the forecast for remaining 35 months. - To calculate the MAD, you will need to calculate the average of the absolute forecast errors for all months. To calculate the MSE you will need to calculate the average mean squared error of the forecast errors for all months. The plot should use the format below (Note that the direction of the lines in the chart in your answer might be different from this figure.): 8502200 Chie Demand + Sud ---E Swing Foca - Sreching Facts Detailed from this example, | Mew Task 5 Questions: 8. What are the MAD and MSE using a = 0.4 to prepare a forecast? What are the MAD and MSE for the forecast prepared with a = 0.2? 9. Which value of a do you recommend should be used for future forecasts? Why? C D E F G H AB 1 Team 3 Data Product ID 1 2 3 4 WN Product XJ-422 Relay SSD-2200 Chip SDD-100 Chip TM-1000X Board Unit Sales Price S 15 $ 22 S 32 $ 120 A CONOWN- 10 Month 11 1 12 2 13 3 14 4 15 5 16 6 17 7 18 8 19 9 20 10 21 11 22 12 23 13 24 14 25 15 26 16 27 17 28 18 29 19 30 20 31 21 Year 2007 2007 2007 2007 2007 2007 2007 2007 2007 2007 2007 2007 2008 2008 2008 2008 2008 2008 2008 2008 2008 Dataset Season 1: Winter 1: Winter 1: Winter 2: Spring 2: Spring 2: Spring 3: Summer 3: Summer 3: Summer 4: Autumn 4: Autumn 4: Autumn 1: Winter 1: Winter 1: Winter 2: Spring 2: Spring 2: Spring 3: Summer 3: Summer 3: Summer Units Sold 500 718 945 1173 1297 1481 1696 1662 1645 1740 1962 2144 2143 2148 2147 2120 2232 2305 2332 2297 2354 Product ID Product Name Sales Revenue 1 1 1 1 1 1 1 1 1 1 1 1 1 1 1 1 1 1 1 1 1 NOORATORE + matting Table Style Clipboard [5 Font [5 Alignment Number Styles L25 for E F G H 1 J L M N 0 0 4 30 31 32 33 34 35 36 37 38 39 40 41 42 43 44 45 46 47 48 49 50 51 52 53 54 55 56 57 58 59 60 . A 20 21 22 23 24 25 26 27 28 29 30 31 32 33 34 35 36 1 2 3 4 5 6 7 8 9 10 11 12 13 14 B 2008 2008 2008 2008 2008 2009 2009 2009 2009 2009 2009 2009 2009 2009 2009 2009 2009 2007 2007 2007 2007 2007 2007 2007 2007 2007 2007 2007 2007 2008 2008 nnn Dataset . C 3: Summer 3: Summer 4: Autumn 4: Autumn 4: Autumn 1: Winter 1: Winter 1: Winter 2: Spring 2: Spring. 2: Spring 3: Summer 3: Summer 3: Summer 4: Autumn 4: Autumn 4: Autumn 1: Winter 1: 1: Winter 1: Winter 2: Spring 2: Spring 2: Spring 3: Summer 3: Summer 3: Summer 4: Autumn 4: Autumn 4: Autumn 1: Winter 1: Winter dad # D 2297 2354 2463 2687 2826 3059 3286 3278 3356 3588 3774 3978 3967 4188 4345 4535 4672 5100 4898 5260 5169 4793 3553 3152 4760 4157 3772 4595 3375 2280 2634 1 1 1 1 1 1 1 1 1 1 1 1 1 1 1 1 1 1 1 1 1 1 2 2 2 2 2 2 2 2 2 2 2 2 2 2 2 2 Paste BIU Format Painter A ES E Merge & Center - $ - % 4.0 .00 .00 0 Insert Delete Format Conditional Format as Cell Formatting Table Styles Styles Clipboard Font Alignment Number Cells L25 X fac F G H 1 J L M N 0 P E 2 2 2 2 2 2 2 2 2 2 2 2 60 61 62 63 64 65 66 67 68 69 70 71 72 73 74 75 76 77 78 79 80 81 82 83 84 85 86 87 88 89 90 A 14 15 16 17 18 19 20 21 22 23 24 25 26 27 28 29 30 31 32 33 34 35 36 1 2 2 3 4 5 6 7 8 8 B B 2008 2008 2008 2008 2008 2008 2008 2008 2008 2008 2008 2009 2009 2009 2009 2009 2009 2009 2009 2009 2009 2009 2009 2007 2007 2007 2007 2007 2007 2007 2007 SA Darat C 1: Winter 1: Winter 2: Spring 2: Spring. 2: Spring 3: Summer 3: Summer 3: Summer 4: Autumn 4: Autumn 4: Autumn 1: Winter 1: Winter 1: Winter 2: Spring 2: Spring 2: Spring 3: Summer 3: Summer 3: Summer 4: Autumn 4: Autumn 4: Autumn 1: Winter 1: Winter 1: Winter 2: Spring 2: Spring 2: Spring 3: Summer 3: Summer 2. D 2634 3667 2291 2960 2951 2844 1768 3180 2830 1952 2932 2094 2476 3898 4063 2311 3995 2594 3874 2565 2463 3562 2443 3200 2676 2328 3784 2358 3099 3904 4110 2 2 2 2 2 2 2 2 2 2 2 2 2 2 2 2 3 3 3 3 3 3 3 3 1 E = = = 70 .00 0 Format Painter Clipboard Formatting Table Styles Styles Font 177 Alignment Number L25 fac P F G H H J K L M N 89 90 91 92 93 94 95 96 97 98 99 100 101 102 103 104 105 106 107 108 109 110 111 112 113 114 115 116 . 7 8 9 10 11 12 13 14 15 16 17 18 19 20 21 22 23 24 25 26 27 28 29 30 31 32 33 34 35 36 -SIXXS98 CONDIMENNINNO ROTUNET B 2007 2007 2007 2007 2007 2007 2008 2008 2008 2008 2008 2008 2008 2008 2008 2008 2008 2008 2009 2009 2009 2009 2009 2009 2009 2009 2009 2009 2009 2009 2007 C 3: Summer 3. Summer 3: Summer 4: Autumn 4: Autumn 4: Autumn 1: Winter 1: Winter 1: Winter 2: Spring 2: Spring 2: Spring 3: Summer 3: Summer 3: Summer 4: Autumn 4: Autumn 4: Autumn 1: Winter 1: Winter 1: Winter 2: Spring 2: Spring 2: Spring 3: Summer 3: Summer 3: Summer 4: Autumn 4: Autumn 4: Autumn 1: Winter D 3904 4110 2647 3372 2513 3459 2858 4151 3314 3619 2896 2509 2200 3651 3365 2703 3820 2527 3058 3214 2558 4126 4104 3119 3137 3745 2831 2547 2742 2895 3000 Awwwwwwwwwwwwwwwwwwwwwwwwwwwwww m 117 118 119 ***** HERRER 40 Dataset + 125 X fi F G 1 J 1 M N 0 0 P E 4 4 4 4 4 4 4 4 4 4 4 4 4 4 4 4 4 4 A 119 1 120 2 2 121 3 122 4 123 5 124 6 125 7 126 8 127 9 128 10 129 11 130 12 131 13 132 14 133 15 134 16 135 17 136 18 137 19 138 20 139 21 140 22 141 23 142 24 143 25 144 26 145 27 146 28 147 29 148 30 149 31 r B B 2007 2007 2007 2007 2007 2007 2007 2007 2007 2007 2007 2007 2008 2008 2008 2008 2008 2008 2008 2008 2008 2008 2008 2008 2009 2009 2009 2009 2009 2009 2009 Dataset 1: Winter 1: Winter 1: Winter 2: Spring 2: Spring 2: Spring 3: Summer 3: Summer 3: Summer 4: Autumn 4 Autumn 4: Autumn 1: Winter 1: Winter 1: Winter 2: Spring 2: Spring 2: Spring 3: Summer 3: Summer 3: Summer 4: Autumn 4: Autumn 4: Autumn 1: Winter 1: Winter 1: Winter 2: Spring 2: Spring 2: Spring 3: Summer D 3000 3016 2991 5074 5124 5129 7595 7409 7403 1807 1881 1734 2988 3095 3091 5475 5423 5374 7157 7144 7266 1118 1211 1227 2938 3078 3075 4804 4865 4720 8054 000 4 4 4 4 4 4 4 4 4 4 4 4 4 4 4 4 4 4 4 + 4 4 4 4 4 4 4 4 4 4 4 4 4 4 131 13 132 14 133 15 134 16 135 17 136 18 137 19 138 20 139 21 140 22 141 23 142 24 143 25 144 26 145 27 146 28 29 148 30 149 31 150 32 151 33 152 34 153 35 154 36 2008 2008 2008 2008 2008 2008 2008 2008 2008 2008 2008 2008 2009 2009 2009 2009 2009 2009 2009 2009 2009 2009 2009 2009 1: Winter 1: Winter 1: Winter 2: Spring 2: Spring 2: Spring 3: Summer 3: Summer 3: Summer 4: Autumn 4: Autumn 4: Autumn 1: Winter 1: Winter 1: Winter 2: Spring 2: Spring 2: Spring 3: Summer 3: Summer 3: Summer 4: Autumn 4: Autumn 4: Autumn 2988 3095 3091 5475 5423 5374 7157 7144 7266 1118 1211 1227 2938 3078 3075 4804 4865 4720 8054 8165 8156 1433 1540 1492 4 4 4 4 4 147 4 4 4 4 4 4 Dataset +


