Question: I need help in this part. Please do it correctly, I need the answers of question 6 and 7 and also the solution of above

I need help in this part. Please do it correctly, I need the answers of question 6 and 7 and also the solution of above methods in excel with the chart. Please do it correctly
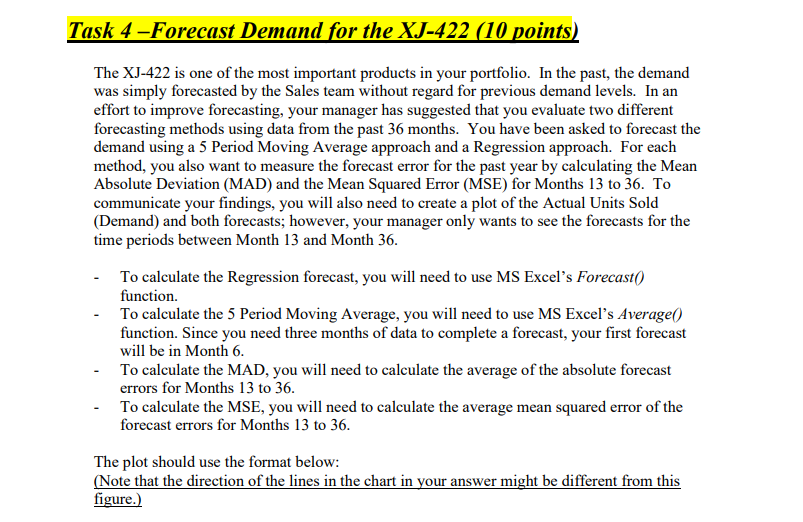
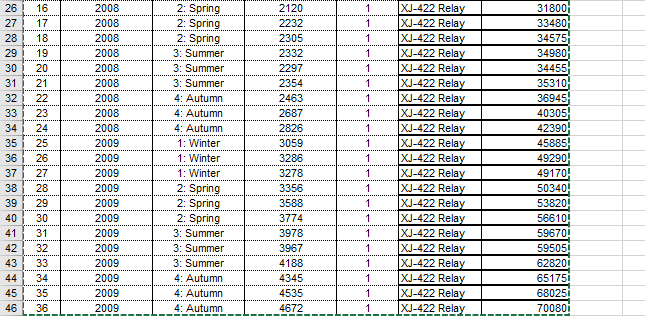
I need help in this part. Please do it correctly,

Month Year Season Units Sold Product ID Product Name Sales Revenue
1 2007 1: Winter 500 1 XJ-422 Relay 7500
2 2007 1: Winter 718 1 XJ-422 Relay 10770
3 2007 1: Winter 945 1 XJ-422 Relay 14175
4 2007 2: Spring 1173 1 XJ-422 Relay 17595
5 2007 2: Spring 1297 1 XJ-422 Relay 19455
6 2007 2: Spring 1481 1 XJ-422 Relay 22215
7 2007 3: Summer 1696 1 XJ-422 Relay 25440
8 2007 3: Summer 1662 1 XJ-422 Relay 24930
9 2007 3: Summer 1645 1 XJ-422 Relay 24675
10 2007 4: Autumn 1740 1 XJ-422 Relay 26100
11 2007 4: Autumn 1962 1 XJ-422 Relay 29430
12 2007 4: Autumn 2144 1 XJ-422 Relay 32160
13 2008 1: Winter 2143 1 XJ-422 Relay 32145
14 2008 1: Winter 2148 1 XJ-422 Relay 32220
15 2008 1: Winter 2147 1 XJ-422 Relay 32205

I need help in this part. Please do it correctly,

Task 4-Forecast Demand for the XJ-422 (10 points) The XJ-422 is one of the most important products in your portfolio. In the past, the demand was simply forecasted by the Sales team without regard for previous demand levels. In an effort to improve forecasting, your manager has suggested that you evaluate two different forecasting methods using data from the past 36 months. You have been asked to forecast the demand using a 5 Period Moving Average approach and a Regression approach. For each method, you also want to measure the forecast error for the past year by calculating the Mean Absolute Deviation (MAD) and the Mean Squared Error (MSE) for Months 13 to 36. To communicate your findings, you will also need to create a plot of the Actual Units Sold (Demand) and both forecasts; however, your manager only wants to see the forecasts for the time periods between Month 13 and Month 36. To calculate the Regression forecast, you will need to use MS Excel's Forecast() function. To calculate the 5 Period Moving Average, you will need to use MS Excel's Average() function. Since you need three months of data to complete a forecast, your first forecast will be in Month 6. To calculate the MAD, you will need to calculate the average of the absolute forecast errors for Months 13 to 36. To calculate the MSE, you will need to calculate the average mean squared error of the forecast errors for Months 13 to 36. The plot should use the format below: (Note that the direction of the lines in the chart in your answer might be different from this figure.) 1 1 1 26 27 28 29 30 31 32 33 34 35 36 37 38 39 40 41 42 43 44 45 46 16 17 18 19 20 21 22 23 24 25 26 27 28 29 30 31 32 33 34 35 36 2008 2008 2008 2008 2008 2008 2008 2008 2008 2009 2009 2009 2009 2009 2009 2009 2009 2009 2009 2009 2009 2: Spring 2: Spring 2: Spring 3: Summer 3: Summer 3: Summer 4: Autumn 4: Autumn 4: Autumn 1: Winter 1: Winter 1: Winter 2: Spring 2: Spring 2: Spring 3: Summer 3: Summer 3: Summer 4: Autumn 4: Autumn 4: Autumn 2120 2232 2305 2332 2297 2354 2463 2687 2826 3059 3286 3278 3356 3588 3774 3978 3967 4188 4345 4535 4672 1 1 1 1 1 1 1 1 1 1 1 1 1 1 1 1 1 1 XJ-422 Relay XJ-422 Relay XJ-422 Relay XJ-422 Relay XJ-422 Relay XJ-422 Relay XJ-422 Relay XJ-422 Relay XJ-422 Relay XJ-422 Relay XJ-422 Relay XJ-422 Relay |XJ-422 Relay XJ-422 Relay XJ-422 Relay XJ-422 Relay XJ-422 Relay XJ-422 Relay XJ-422 Relay XJ-422 Relay XJ-422 Relay 31800 33480 34575 34980' 34455 35310 36945! 40305 42390 45885! 49290! 49170 50340! 53820 56610! 59670 59505! 62820! 651751 680251 700801

Step by Step Solution

There are 3 Steps involved in it

1 Expert Approved Answer
Step: 1 Unlock blur-text-image
Question Has Been Solved by an Expert!

Get step-by-step solutions from verified subject matter experts

Step: 2 Unlock
Step: 3 Unlock

Students Have Also Explored These Related General Management Questions!