

Question: I need help in this question and please use the below formula and also show the work. Please do not make any mistake. Please must
I need help in this question and please use the below formula and also show the work. Please do not make any mistake. Please must show the work and solve in Ms word.
Please follow below formulas and example:
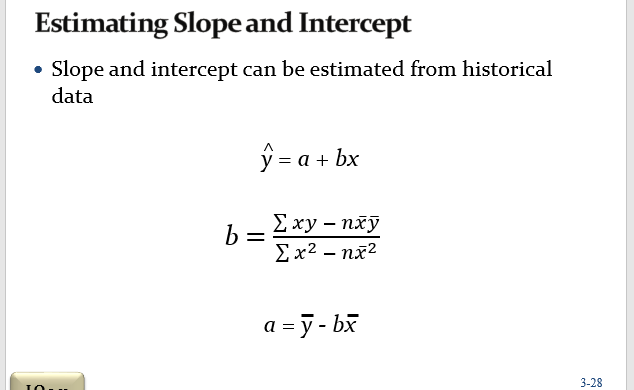
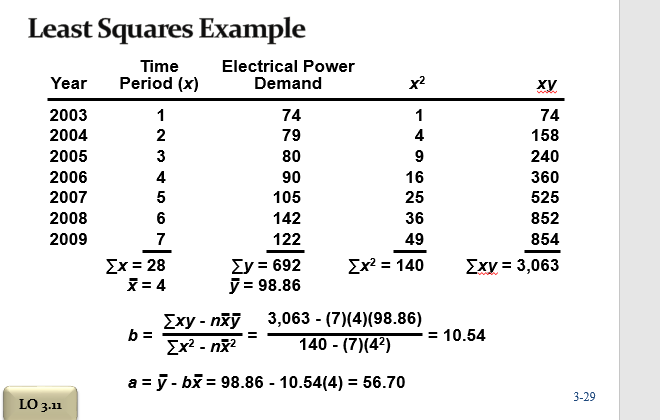
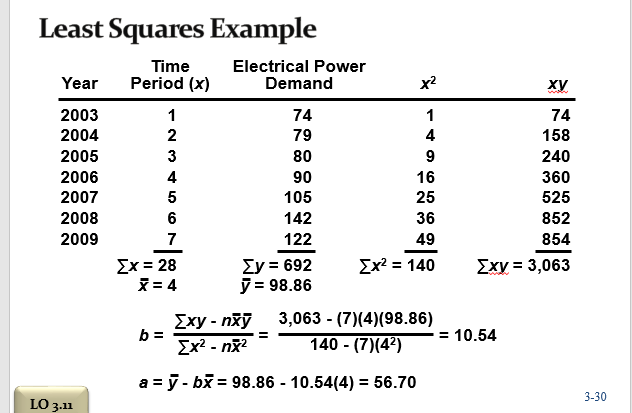
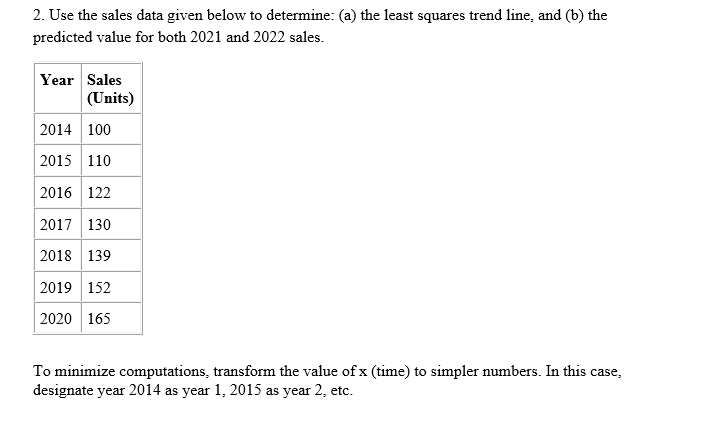
2. Use the sales data given below to determine: (a) the least squares trend line, and (b) the predicted value for both 2021 and 2022 sales. Year Sales (Units) 2014 100 2015 110 2016 122 2017 130 2018 139 2019 152 2020 165 To minimize computations, transform the value of x (time) to simpler numbers. In this case, designate year 2014 as year 1, 2015 as year 2, etc. Estimating Slope and Intercept Slope and intercept can be estimated from historical data = a + bx b = Exy xy 2 mx2 a = - bx 3-28 Least Squares Example Time Electrical Power Year Period (x) Demand x2 2003 1 74 1 74 2004 2 79 4 158 2005 3 80 9 240 2006 4 90 16 360 2007 5 105 25 525 2008 6 142 36 852 2009 7 122 49 854 x = 28 Ey = 692 x? = 140 Exy = 3,063 X= 4 y = 98.86 Exy - nzy 3,063 - (7)(4)(98.86) b = = 10.54 Ex2 - nx2 140 - (7)(42) a = y - bx = 98.86 - 10.54(4) = 56.70 3-29 LO 3.11 80 Least Squares Example Time Electrical Power Year Period (x) Demand x2 2003 1 74 1 74 2004 2 79 4 158 2005 3 9 240 2006 4 90 360 2007 5 105 25 525 2008 6 142 36 852 2009 7 122 49 854 x = 28 y = 692 x? = 140 Exy = 3,063 X = 4 y = 98.86 Exy-nzy 3,063 - (7)(4)98.86) b= = 10.54 Ex2 - nx2 140 - (7)(42) 16 a = y-bx = 98.86 - 10.54(4) = 56.70 3-30 LO 3.11
Step by Step Solution
There are 3 Steps involved in it
1 Expert Approved Answer
Step: 1 Unlock

Question Has Been Solved by an Expert!
Get step-by-step solutions from verified subject matter experts
Step: 2 Unlock
Step: 3 Unlock