

Question: I need help interpreting these graphs created in R Studio Results Marital Status and Depression 1. 00 - 0.75 - Depressed ( Days ) Home
I need help interpreting these graphs created in R Studio
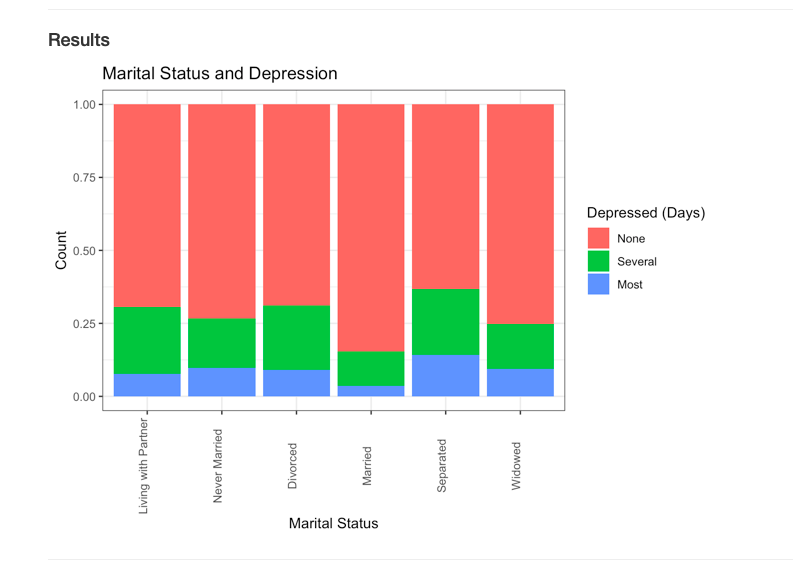
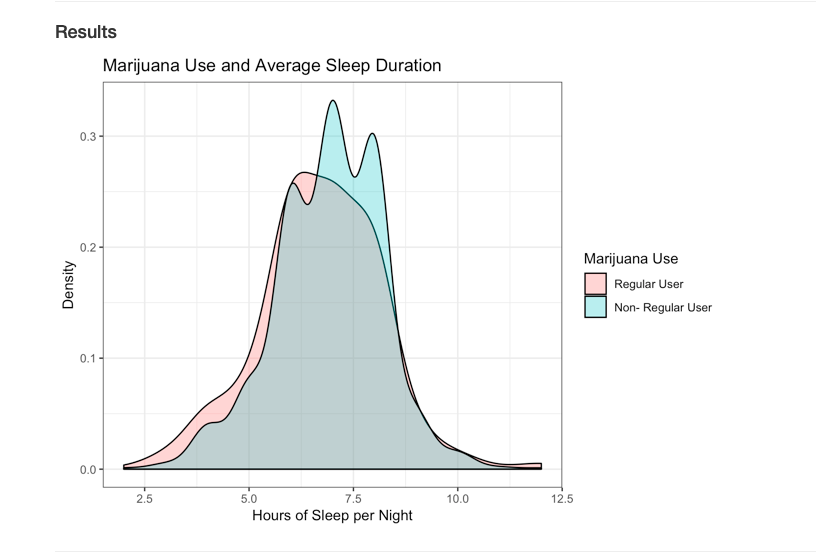
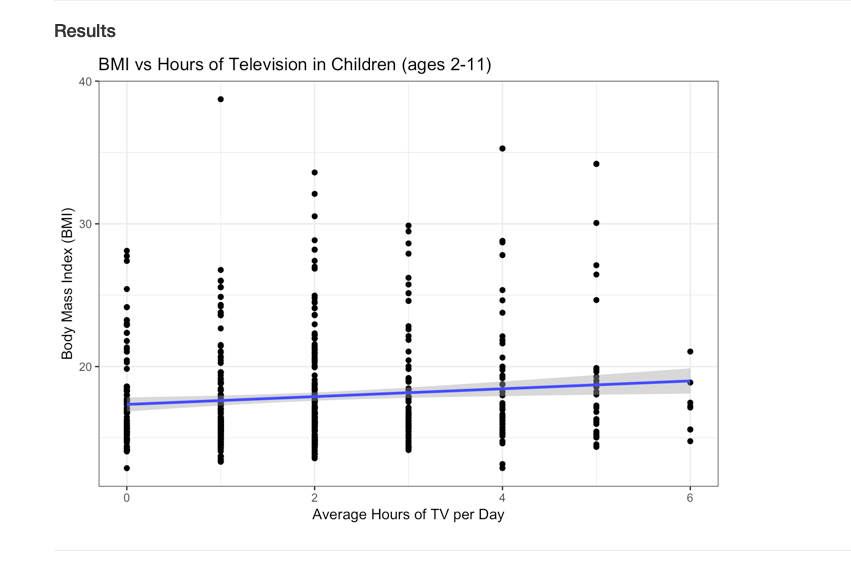
Results Marital Status and Depression 1. 00 - 0.75 - Depressed ( Days ) Home Count 0.50 - Several Most 0. 25 - Living with Partner_ Separated Married Widowed Never Married Divorced Marital StatusResults Marijuana Use and Average Sleep Duration Marijuana Use Density Regular User Non - Regular USER 21. 1 - 0.0 - 2.5 5.0 7. 5 10.0 12.5 Hours of Sleep per NightResults BMI VS Hours of Television in Children ( ages 2 - 1 1 ) 40 30 Body Mass Index ( BMY ) 2 Average Hours of TV per Day
Step by Step Solution
There are 3 Steps involved in it
1 Expert Approved Answer
Step: 1 Unlock

Question Has Been Solved by an Expert!
Get step-by-step solutions from verified subject matter experts
Step: 2 Unlock
Step: 3 Unlock