

Question: I need help knowing where to place points on the attached graph for this question!! Anything is appreciated!! 5. Operating break-even graph analysis When does
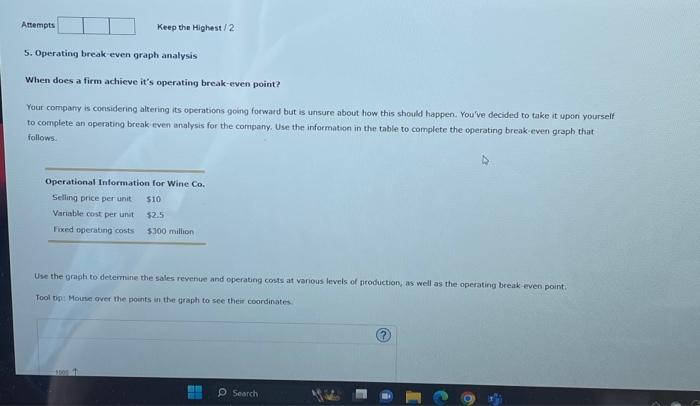
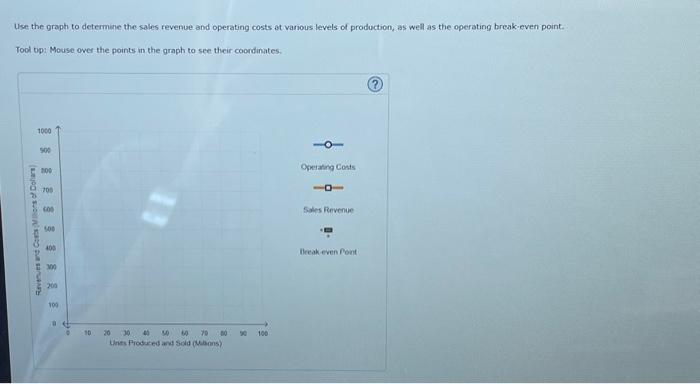
5. Operating break-even graph analysis When does a firm achieve it's operating break-even point? Your company is considering altering its operations going forward but is unsure about how this should happen. You've decided to take it upen yourself to complete an operating break even analysis for the company. Use the information in the table to complete the operating break-even graph that follows. Use the gragh to determine the sales revenue and operating costs at various levels of rroduction, as well as the operating break eveo point: Fool bp: Moune over the points in the graph to see their coordinates. Use the graph to determine the sales revenue and operating costs at vanous levels of production, as well as the operating break-even point. Tool top: Mouse over the points in the graph to see their coordinates
Step by Step Solution
There are 3 Steps involved in it

Get step-by-step solutions from verified subject matter experts