

Question: I need help learning to create a BCG and GE/Mckinsey matrix with the following information. Please and thank you! 520 STRATEGIC MANAGEMENT CASES EXHIBIT 2
I need help learning to create a BCG and GE/Mckinsey matrix with the following information. Please and thank you!
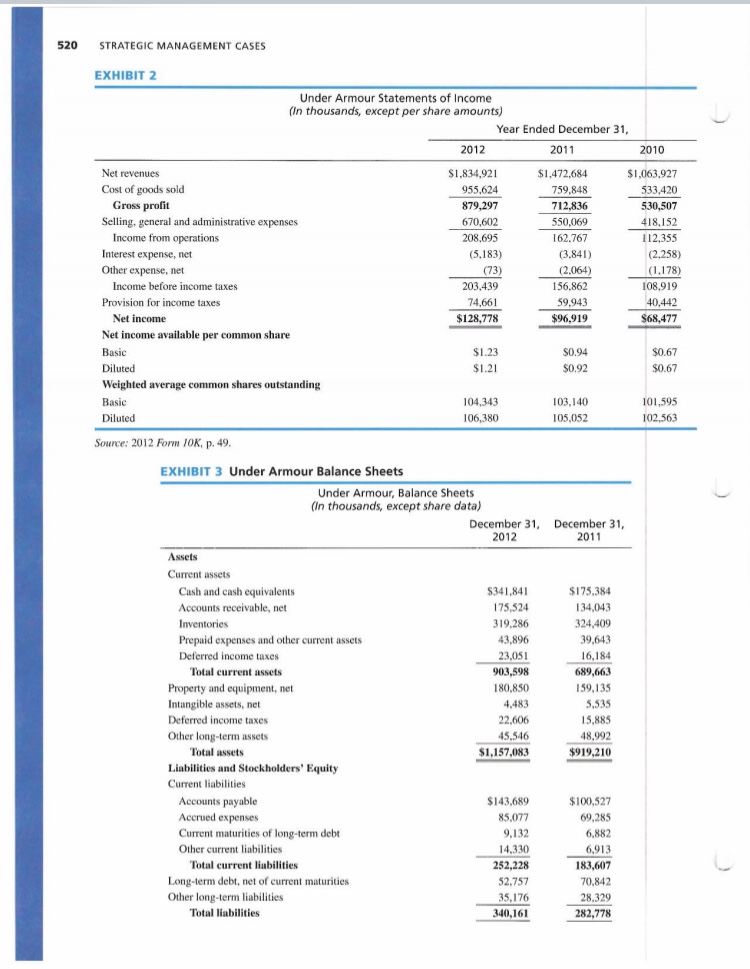
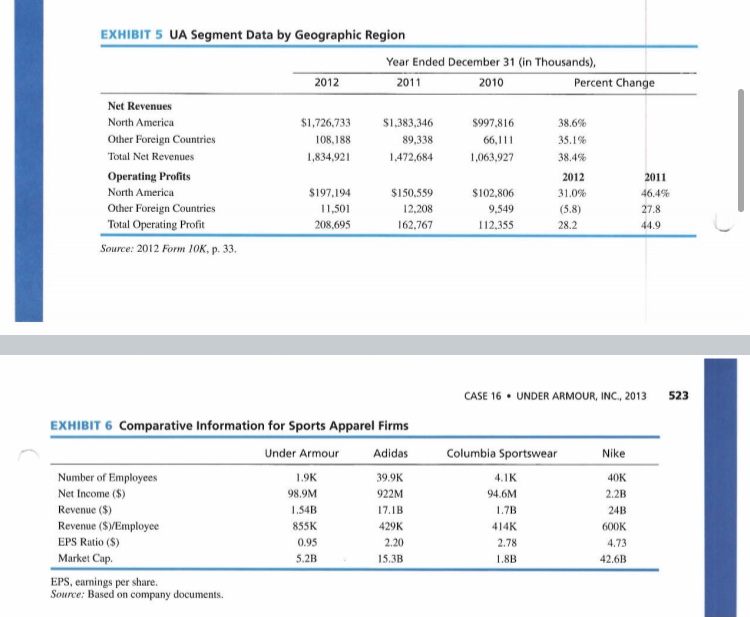
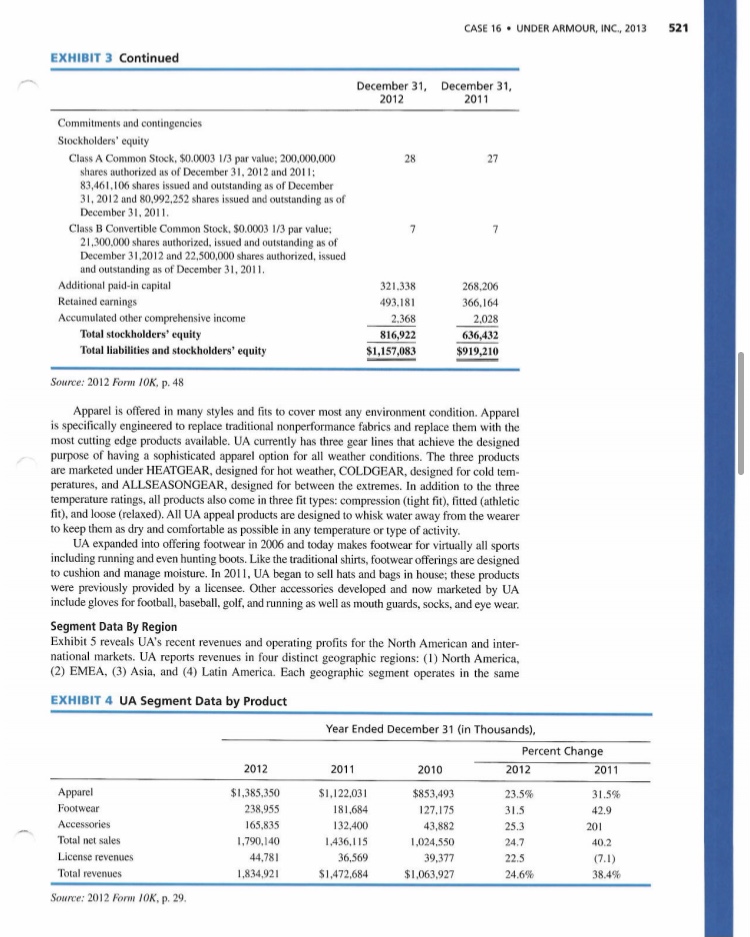
520 STRATEGIC MANAGEMENT CASES EXHIBIT 2 Under Armour Statements of Income (In thousands, except per share amounts) Year Ended December 31, 2012 2011 2010 Net revenues Cost of goods sold Gross profit Selling, general and administrative expenses Income from operations Interest expense, net Other expense, net Income before income taxes Provision for income taxes Net income Net income available per common share Basic Diluted Weighted average common shares outstanding Basic Diluted Source: 2012 Form 10K, p. 49. $1,834,921 955,624 879,297 670,602 208.695 (5,183) (73) 203,439 74,661 $128,778 $1,472,684 759,848 712.836 550,069 162,767 re? (3.841) 0.041 (2.064) TAVO 156,862 59.943 $96,919 $1,063.927 533,420 530,507 418,152 112,355 (2.258) 4.13) (1.178) 108,919 40,442 $68,477 S1.23 $1.21 $0.94 $0.92 $0.67 $0.67 104,343 106,380 103,140 105,052 101.595 102,563 EXHIBIT 3 Under Armour Balance Sheets Under Armour, Balance Sheets (In thousands, except share data) December 31, December 31, 2012 2011 Assets Current assets Cash and cash equivalents $341,841 $175,384 Accounts receivable, net 175,524 134,043 Inventories 319.286 324,409 Prepaid expenses and other current assets 43.896 39,643 Deferred income taxes 23.051 16,184 Total current assets 903,598 689,663 Property and equipment, net 180,850 159,135 Intangible assets, net 4,483 5.535 Deferred income taxes 22,606 15,885 Other long-term assets 45.546 48,992 Total assets $1,157,083 $919,210 Liabilities and Stockholders' Equity Current liabilities Accounts payable $143,689 $100,527 Accrued expenses 85,077 69,285 Current maturities of long-term debt 9,132 6,882 Other current liabilities 14,330 6,913 Total current liabilities 252,228 183,607 Long-term debt, net of current maturities 52.757 70,842 Other long-term liabilities 28.329 Total liabilities 340,161 282,778 35,176 EXHIBIT 5 UA Segment Data by Geographic Region Year Ended December 31 (in Thousands), 2012 2011 2010 Percent Change Net Revenues North America $1,726,733 $1,383,346 $997,816 38.6% Other Foreign Countries 108,188 89,338 66,111 35.1% Total Net Revenues 1,834,921 1,472,684 1,063.927 38.4% Operating Profits 2012 2011 North America $197.194 $150.559 $102,806 31.0% 46.4% Other Foreign Countries 11,501 12.208 9.549 (5.8) 27.8 Total Operating Profit 208,695 162,767 112,355 28.2 44.9 Source: 2012 Form 10K, p. 33. CASE 16. UNDER ARMOUR, INC., 2013 523 EXHIBIT 6 Comparative Information for Sports Apparel Firms Under Armour Adidas Number of Employees 1.9K 39.9K Net Income ($) 98.9M 922M Revenue ($) 1.54B 17.1B Revenue (SWEmployee 855K 429K EPS Ratio ($) 0.95 2.20 Market Cap. 5.2B 15.3B EPS, earnings per share. Source: Based on company documents. Columbia Sportswear 4.1K 94.6M 1.7B 414K 2.78 1.8B Nike 40K 2.2B 24B 600K 4.73 42.6B CASE 16. UNDER ARMOUR, INC., 2013 521 EXHIBIT 3 Continued December 31, December 31, 2012 2011 28 27 7 7 Commitments and contingencies Stockholders' equity Class A Common Stock, $0.0003 1/3 par value: 200,000,000 shares authorized as of December 31, 2012 and 2011; 83,461,106 shares issued and outstanding as of December 31, 2012 and 80,992,252 shares issued and outstanding as of December 31, 2011 Class B Convertible Common Stock, 50.0003 1/3 par value: 21,300,000 shares authorized, issued and outstanding as of December 31,2012 and 22,500,000 shares authorized, issued and outstanding as of December 31, 2011, Additional paid-in capital Retained carnings Accumulated other comprehensive income Total stockholders' equity Total liabilities and stockholders' equity 321.338 493,181 2.368 816,922 $1,157,083 268,206 366,164 2.028 636,432 $919,210 Source: 2012 Form 10K, p. 48 Apparel is offered in many styles and fits to cover most any environment condition. Apparel is specifically engineered to replace traditional nonperformance fabrics and replace them with the most cutting edge products available. UA currently has three gear lines that achieve the designed purpose of having a sophisticated apparel option for all weather conditions. The three products are marketed under HEATGEAR, designed for hot weather, COLDGEAR, designed for cold tem peratures, and ALLSEASONGEAR, designed for between the extremes. In addition to the three temperature ratings, all products also come in three fit types: compression (tight fit), fitted (athletic fit), and loose (relaxed). All UA appeal products are designed to whisk water away from the wearer to keep them as dry and comfortable as possible in any temperature or type of activity. UA expanded into offering footwear in 2006 and today makes footwear for virtually all sports including running and even hunting boots. Like the traditional shirts, footwear offerings are designed to cushion and manage moisture. In 2011, UA began to sell hats and bags in house; these products were previously provided by a licensee. Other accessories developed and now marketed by UA include gloves for football, baseball, golf, and running as well as mouth guards, socks, and eye wear. Segment Data By Region Exhibit 5 reveals UA's recent revenues and operating profits for the North American and inter- national markets. UA reports revenues in four distinct geographic regions: (1) North America, (2) EMEA, (3) Asia, and (4) Latin America. Each geographic segment operates in the same EXHIBIT 4 UA Segment Data by Product Year Ended December 31 (in Thousands), Percent Change 2012 2011 2010 2012 2011 Apparel $1,385,350 $1,122,031 $853,493 23.5% 31.5% Footwear 238,955 181,684 127.175 31.5 42.9 Accessories 165,835 132,400 43,882 25.3 201 Total net sales 1,790,140 1.436,115 1,024,550 24.7 40.2 License revenues 44,781 36,569 39,377 (7.1) Total revenues 1,834.921 $1,472,684 $1,063.927 24.6% 38.4% 22.5 Source: 2012 Form IOK p. 29
Step by Step Solution
There are 3 Steps involved in it

Get step-by-step solutions from verified subject matter experts