

Question: I need help making a dot plot for table 2!! Use the B-galactosidase activity measurements from Table 2 to make a dot plot that highlights
I need help making a dot plot for table 2!! Use the B-galactosidase activity measurements from Table 2 to make a dot plot that highlights your results and makes them easy to interpret using the graph below. Include the results for both trials as well as their averages. (Use a dot for each trial and a line between them for the average).
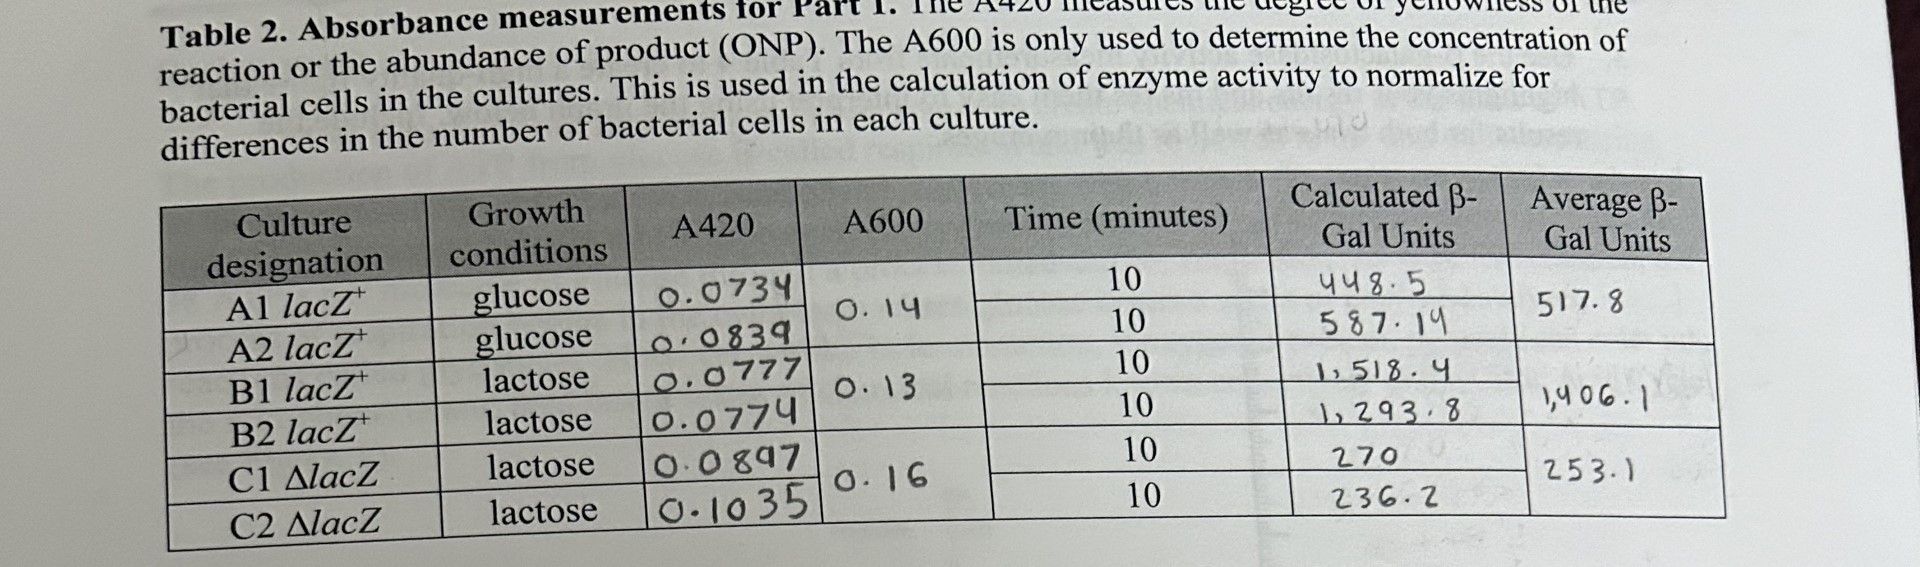
Table 2. Absorbance measurements for Part 1. reaction or the abundance of product (ONP). The A600 is only used to determine the concentration of CSS Of the bacterial cells in the cultures. This is used in the calculation of enzyme activity to normalize for differences in the number of bacterial cells in each culture. 10 Culture Growth A420 designation conditions A600 Time (minutes) Calculated B- Average B- Gal Units Al lacZ glucose 0. 0734 Gal Units 10 A2 lacZ glucose 0. 14 4 48. 5 0 . 0839 10 587. 19 517. 8 B1 lacZ lactose 0 . 0777 0. 13 10 1, 518 . 4 B2 lacZ lactose 0. 0774 10 1, 293 . 8 1,4 06 . 1 C1 AlacZ lactose 0. 0897 10 270 C2 AlacZ lactose 10 . 1035 0. 16 10 253. 1 236. 2
Step by Step Solution
There are 3 Steps involved in it

Get step-by-step solutions from verified subject matter experts